
Near extends losing streak amid selling pressure holding price under key resistance

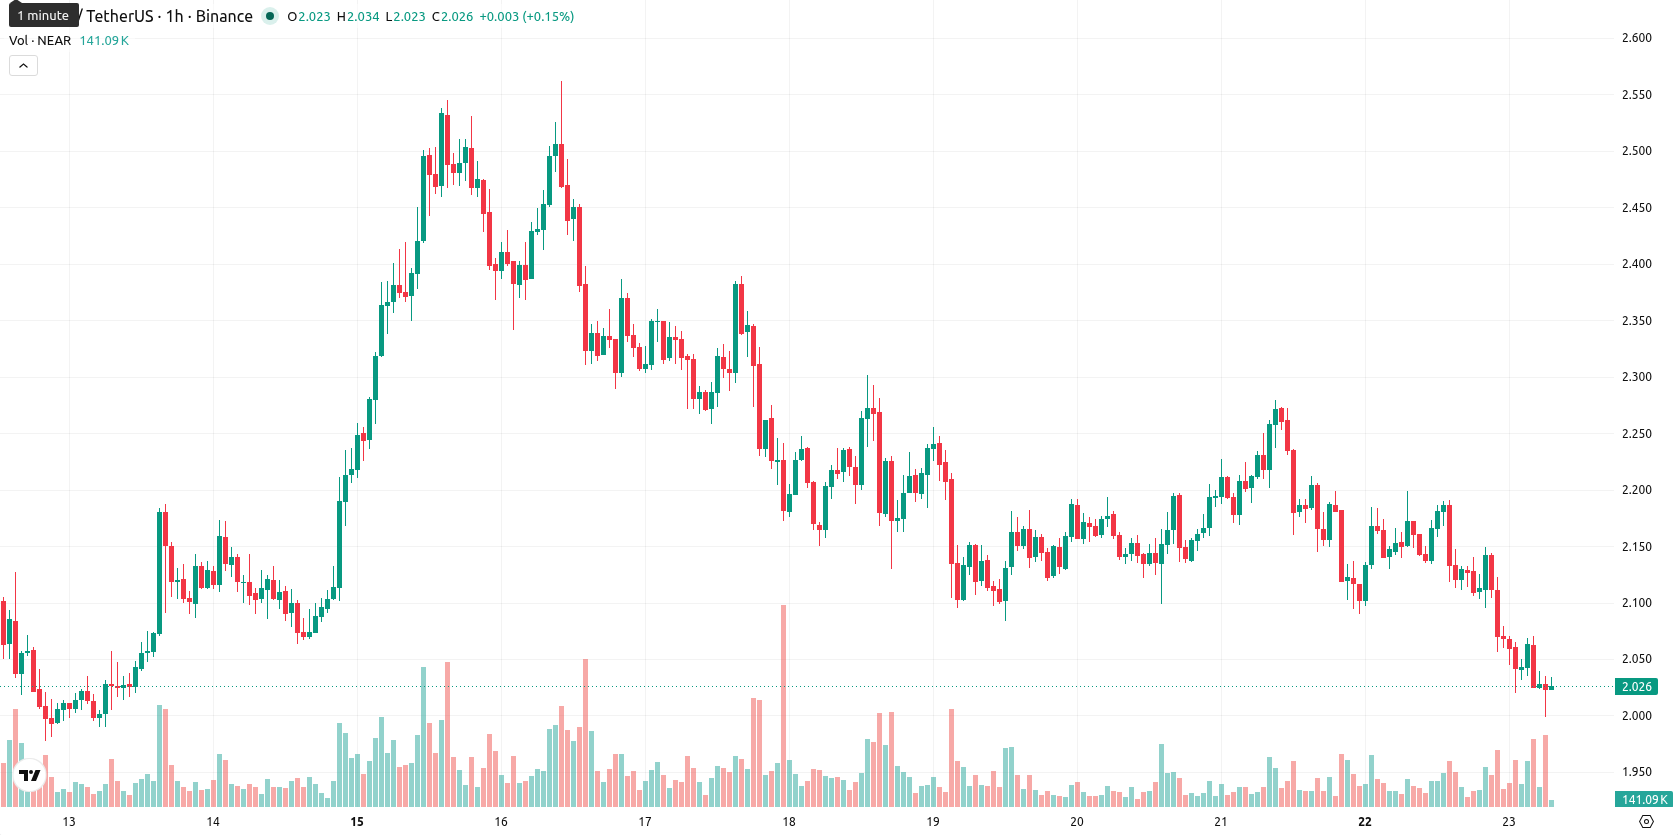
Near (NEAR) is trading at $2.02, down 7.57% over the past 24 hours. The price sits below its main trend benchmarks, indicating a short-term negative structure and underperformance versus key moving averages.
Highlights
- NEAR/USD remains under strong short- and medium-term selling pressure, indicating a dominant bearish trend.
- Bearish momentum is reinforced by oversold readings and high intraday volatility, suggesting sellers are currently in control.
- Price is expected to trade between $1.843 and $2.1025 over the next few days, with continued downside favored unless support fails or resistance breaks.
Downside momentum persists as resistance and oversold signals align
On the H1 timeframe, NEAR/USD remains below the MA-20 at $2.09 and MA-50 at $2.14, confirming prevailing short- and medium-term resistance. The price continues to hold above the daily MA-200 at $1.53, with the Ichimoku Kijun line near $2.10 acting as immediate resistance overhead. Momentum indicators reinforce the downside, with RSI at 32.45 and MACD showing Sell conditions, while Bull/Bear Power (BBP) also confirms dominant seller control. Stoch RSI and Commodity Channel Index (CCI) are both in Oversold territory, suggesting sellers may be near exhaustion. The Average Directional Index (ADX) remains Neutral, offering no confirmation of trend strength, while the Awesome Oscillator supports the downward move. High session volatility is reflected by the sharp intraday decline, and price currently trades in the middle of today's range.
Limited rebound prospects as downside risk remains dominant
In the short term, NEAR/USD is likely to fluctuate between $1.84 and $2.10, with typical volatility for the asset. The probability of an upside breakout appears minimal given sustained momentum signals, while the scenario for further declines remains elevated. A return to bullish action would require a decisive move above $2.10, whereas a drop below $1.84 would open risk for additional losses in the days ahead.
Previously it was reported that downside risks remained elevated for NEAR with technical signals keeping the near-term outlook cautious. The latest data reinforce this bias, and traders should closely monitor for a decisive move above $2.10 or a sustained break below $1.84 to gauge the next directional shift.


-
 Afghanistan
-
 Albania
-
 Algeria
-
 Angola
-
 Argentina
-
 Armenia
-
 Australia
-
 Austria
-
 Azerbaijan
-
 Bahamas
-
 Bahrain
-
 Bangladesh
-
 Belarus
-
 Belgium
-
 Bolivia
-
 Botswana
-
 Brazil
-
 Brunei
-
 Bulgaria
-
 Cambodia
-
 Cameroon
-
 Canada
-
 Chile
Chile
-
 China
China
-
 Colombia
-
 Congo
Congo
-
 Costa Rica
-
 Cote d'Ivoire
-
 Croatia
-
 Cuba
Cuba
-
 Cyprus
-
 Czechia
-
 DR Congo
-
 Denmark
-
 Dominican Republic
-
 Ecuador
-
 Egypt
Egypt
-
 El Salvador
-
 Estonia
-
 Eswatini
-
 Ethiopia
-
 Finland
-
 France
-
 Georgia
-
 Germany
-
 Ghana
Ghana
-
 Greece
-
 Haiti
Haiti
-
 Hong Kong
-
 Hungary
-
 India
India
-
 Indonesia
-
 Iran, Islamic republic
-
 Iraq
Iraq
-
 Ireland
-
 Israel
-
 Italy
Italy
-
 Jamaica
-
 Japan
Japan
-
 Jordan
-
 Kazakhstan
-
 Kenya
Kenya
-
 Korea
Korea
-
 Kuwait
-
 Kyrgyzstan
-
 Laos
Laos
-
 Latvia
-
 Lebanon
-
 Lesotho
-
 Libya
Libya
-
 Lithuania
-
 Luxembourg
-
 Madagascar
-
 Malaysia
-
 Malta
Malta
-
 Mauritius
-
 Mexico
-
 Moldova
-
 Mongolia
-
 Montenegro
-
 Morocco
-
 Mozambique
-
 Myanmar
-
 Namibia
-
 Nepal
Nepal
-
 Netherlands
-
 New Zealand
-
 Nigeria
-
 North Macedonia
-
 Norway
-
 Oman
Oman
-
 Pakistan
-
 Palestine
-
 Panama
-
 Papua New Guinea
-
 Paraguay
-
 Peru
Peru
-
 Philippines
-
 Poland
-
 Portugal
-
 Puerto Rico
-
 Qatar
Qatar
-
 Reunion
-
 Romania
-
 Rwanda
-
 Saudi Arabia
-
 Serbia
-
 Singapore
-
 Slovakia
-
 Slovenia
-
 Somalia
-
 South Africa
-
 Spain
Spain
-
 Sri Lanka
-
 Sweden
-
 Switzerland
-
 Syria
Syria
-
 Taiwan
-
 Tajikistan
-
 Tanzania
-
 Thailand
-
 Trinidad and Tobago
-
 Tunisia
-
 Turkey
-
 UAE
UAE
-
 Uganda
-
 Ukraine
-
 United Kingdom
-
United States
-
 Uruguay
-
 Uzbekistan
-
 Venezuela
-
 Vietnam
-
 Yemen
Yemen
-
 Zambia
-
 Zimbabwe
- Forex
- Crypto
