
Movement price prediction: Will the $0.0104–$0.0112 range hold as MOVE sinks 7.69%?

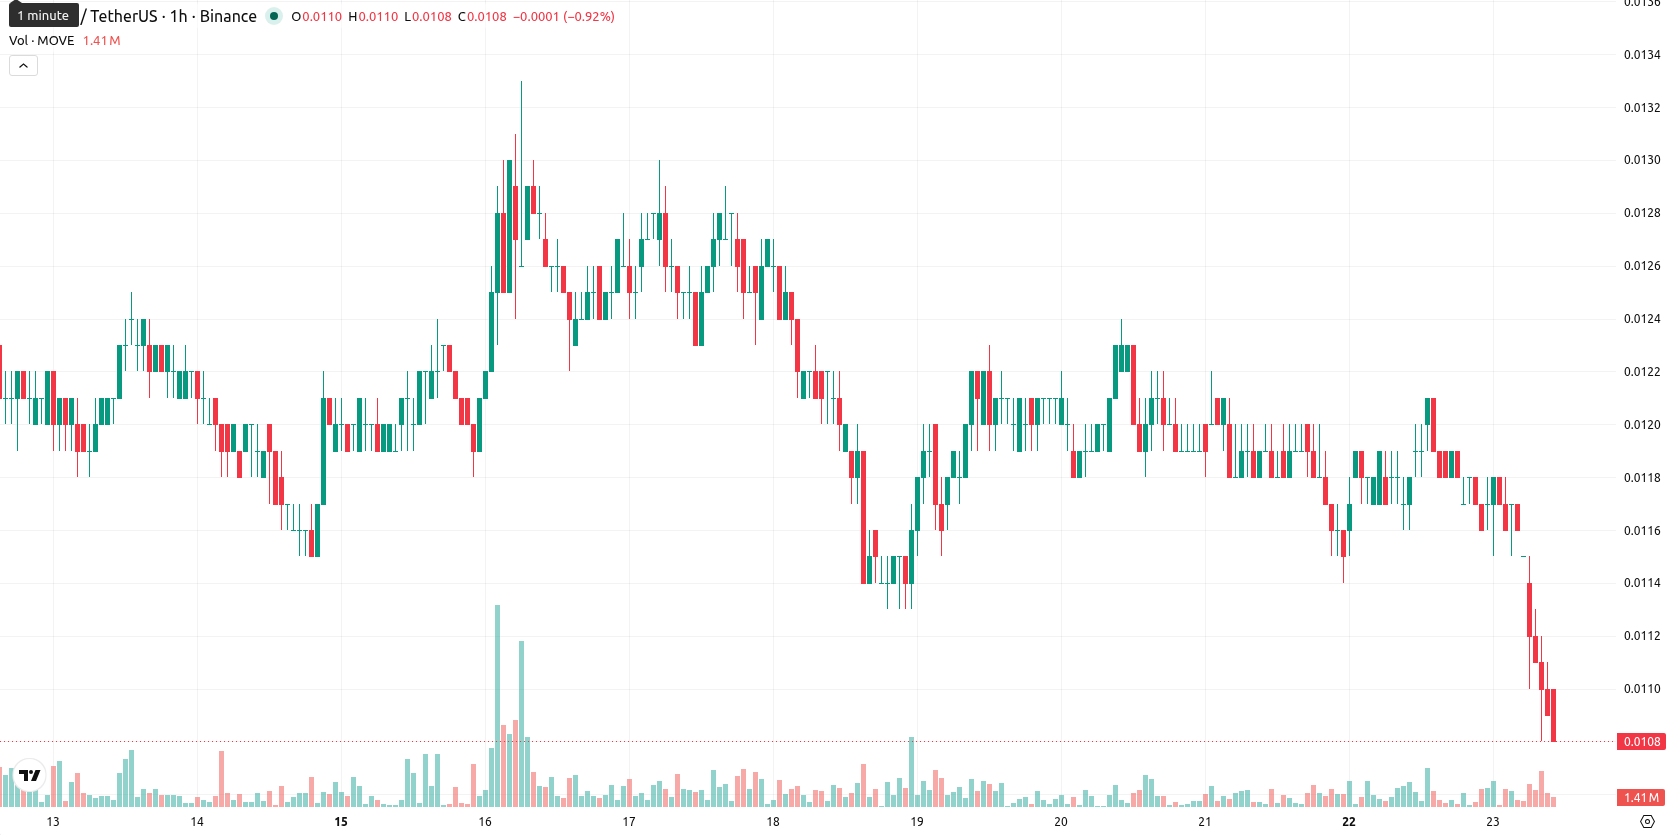
Movement (MOVE) is trading at $0.0108, marking a sharp daily decline of 7.69%. The asset is situated below its key moving averages after today's sell-off.
Highlights
- MOVE/USD faces strong bearish momentum, trading below key moving averages and failing to break immediate resistance at 0.0115.
- Momentum and volatility indicators confirm sustained downward pressure, with sentiment and technical signals strongly favoring sellers.
- Price is projected to fluctuate between 0.0104 and 0.0112 over the next 2–3 days, with further losses more likely than reversal.
Bearish momentum persists as technical signals flag oversold conditions
On the technical front, MOVE/USD trades below the MA-20 ($0.0116) and MA-50 ($0.0117) on the hourly chart, with the price also well below the longer-term MA-200 ($0.0237). The Ichimoku Kijun sits at $0.0115, establishing immediate resistance for any potential recovery. Momentum signals remain negative, with MACD and ADX both indicating sell conditions. RSI (26.36), Stoch RSI, and CCI are all in oversold territory, suggesting intense downward momentum, while BBP confirms sellers dominating intraday price action. The Awesome Oscillator provides further evidence of sustained bearish bias, and there are no notable divergences across oscillators or indicators at this time.
Renewed downside risk as narrow trading band signals trend continuation
In the upcoming 2–3 trading days, MOVE/USD is projected to fluctuate between $0.0104 and $0.0112, reflecting a typical volatility band relative to current levels. The probability of a reversal is very low, while the likelihood of further declines remains high. A break above $0.0115 would be needed to shift momentum, but further losses are expected if the price drops below $0.0104.
Earlier, analysts noted that Movement had shifted toward short-term bullish momentum while remaining vulnerable to broader trend uncertainties. The latest technical breakdown marks a decisive change, with sellers now firmly in control and $0.0104 emerging as the critical level to monitor for potential acceleration of downside risk.


-
 Afghanistan
-
 Albania
-
 Algeria
-
 Angola
-
 Argentina
-
 Armenia
-
 Australia
-
 Austria
-
 Azerbaijan
-
 Bahamas
-
 Bahrain
-
 Bangladesh
-
 Belarus
-
 Belgium
-
 Bolivia
-
 Botswana
-
 Brazil
-
 Brunei
-
 Bulgaria
-
 Cambodia
-
 Cameroon
-
 Canada
-
 Chile
Chile
-
 China
China
-
 Colombia
-
 Congo
Congo
-
 Costa Rica
-
 Cote d'Ivoire
-
 Croatia
-
 Cuba
Cuba
-
 Cyprus
-
 Czechia
-
 DR Congo
-
 Denmark
-
 Dominican Republic
-
 Ecuador
-
 Egypt
Egypt
-
 El Salvador
-
 Estonia
-
 Eswatini
-
 Ethiopia
-
 Finland
-
 France
-
 Georgia
-
 Germany
-
 Ghana
Ghana
-
 Greece
-
 Haiti
Haiti
-
 Hong Kong
-
 Hungary
-
 India
India
-
 Indonesia
-
 Iran, Islamic republic
-
 Iraq
Iraq
-
 Ireland
-
 Israel
-
 Italy
Italy
-
 Jamaica
-
 Japan
Japan
-
 Jordan
-
 Kazakhstan
-
 Kenya
Kenya
-
 Korea
Korea
-
 Kuwait
-
 Kyrgyzstan
-
 Laos
Laos
-
 Latvia
-
 Lebanon
-
 Lesotho
-
 Libya
Libya
-
 Lithuania
-
 Luxembourg
-
 Madagascar
-
 Malaysia
-
 Malta
Malta
-
 Mauritius
-
 Mexico
-
 Moldova
-
 Mongolia
-
 Montenegro
-
 Morocco
-
 Mozambique
-
 Myanmar
-
 Namibia
-
 Nepal
Nepal
-
 Netherlands
-
 New Zealand
-
 Nigeria
-
 North Macedonia
-
 Norway
-
 Oman
Oman
-
 Pakistan
-
 Palestine
-
 Panama
-
 Papua New Guinea
-
 Paraguay
-
 Peru
Peru
-
 Philippines
-
 Poland
-
 Portugal
-
 Puerto Rico
-
 Qatar
Qatar
-
 Reunion
-
 Romania
-
 Rwanda
-
 Saudi Arabia
-
 Serbia
-
 Singapore
-
 Slovakia
-
 Slovenia
-
 Somalia
-
 South Africa
-
 Spain
Spain
-
 Sri Lanka
-
 Sweden
-
 Switzerland
-
 Syria
Syria
-
 Taiwan
-
 Tajikistan
-
 Tanzania
-
 Thailand
-
 Trinidad and Tobago
-
 Tunisia
-
 Turkey
-
 UAE
UAE
-
 Uganda
-
 Ukraine
-
 United Kingdom
-
United States
-
 Uruguay
-
 Uzbekistan
-
 Venezuela
-
 Vietnam
-
 Yemen
Yemen
-
 Zambia
-
 Zimbabwe
- Forex
- Crypto
