
Banklesstimes reports long liquidations driving Celestia lower

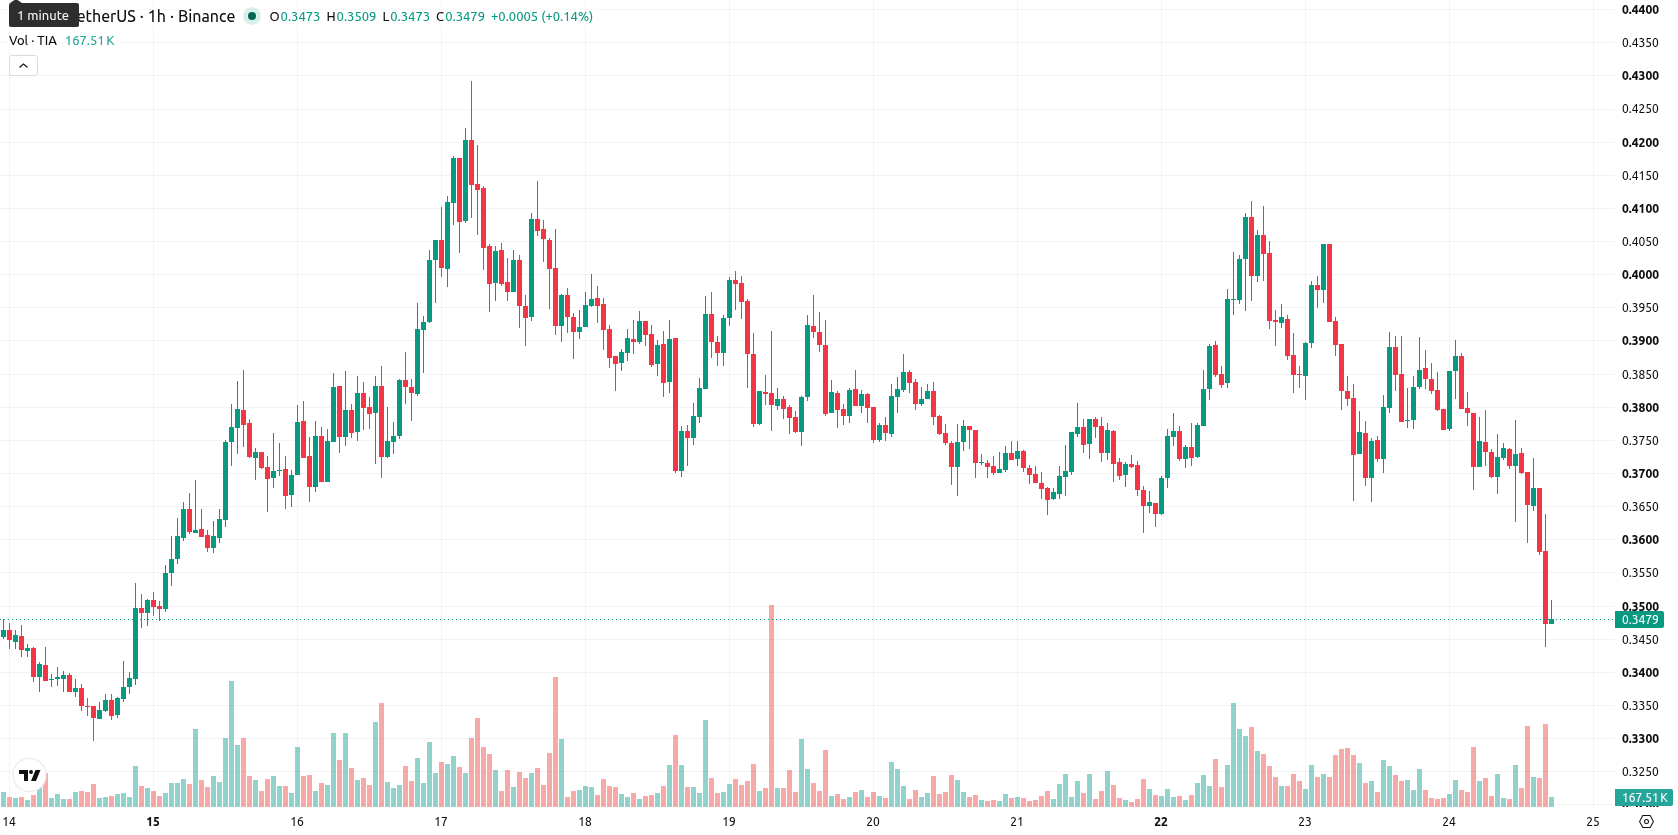
Celestia (TIA) is trading at $0.3492, sharply down by 7.79% today. The asset remains below its key moving averages, reflecting strong downside momentum.
Highlights
- Celestia's 24-hour trading volume surged to $35.8 million as market activity and volatility increased sharply.
- Significant liquidations of long positions occurred, with buyers temporarily defending a key support and cushioning immediate downside.
- Technicals show persistent selling pressure, with downside momentum dominant and the expected price range between $0.3315 and $0.3604.
Elevated turnover drives volatility amid buyer liquidations and support test
Celestia recorded a notable increase in trading activity, with its 24-hour volume reaching $35.8 million and its market capitalization standing at $368.36 million, according to Tronweekly. This heightened turnover reflects elevated short-term volatility and contributed to price fluctuations as the market adjusted to increased participation. Additionally, Banklesstimes reported that long positions encountered significant liquidations while buyers attempted to sustain an immediate support level, temporarily cushioning further losses amid these pressures.
Overwhelming seller dominance as technical indicators reinforce bearish stance
The price currently trades below the 20-day ($0.3733), 50-day ($0.3816), and 200-day ($0.3979) moving averages, while the Ichimoku Kijun level at $0.373 marks immediate resistance. The Moving Average Convergence Divergence (MACD) signals a sell, and the Average Directional Index (ADX) is neutral, indicating weak bullish momentum and a lack of clear trend direction. The Relative Strength Index (RSI) stands at 32.507, reflecting ongoing selling pressure, while Stochastic RSI and Commodity Channel Index (CCI) confirm the market is oversold. Bull/Bear Power and the Awesome Oscillator also reinforce the dominance of sellers in the current environment.
Low recovery chance as price consolidates within volatile band
In the short term, TIA is expected to move sideways within a volatility band between $0.3315 and $0.3604. The probability of a recovery is very low, while the likelihood of continued declines is high. The baseline scenario sees price consolidating within the stated range; a bullish reversal would require a sustained break above the $0.373 resistance, while a breach below $0.3315 support would set up the next leg lower.
Earlier, analysts noted that Celestia was experiencing sustained selling pressure amid shifting market sentiment and heightened volatility. The current technical and volume signals reinforce this prevailing downside momentum, making a decisive break of the $0.373 resistance level the key indicator for any potential reversal.


Latest Celestia News


-
 Afghanistan
-
 Albania
-
 Algeria
-
 Angola
-
 Argentina
-
 Armenia
-
 Australia
-
 Austria
-
 Azerbaijan
-
 Bahamas
-
 Bahrain
-
 Bangladesh
-
 Belarus
-
 Belgium
-
 Bolivia
-
 Botswana
-
 Brazil
-
 Brunei
-
 Bulgaria
-
 Cambodia
-
 Cameroon
-
 Canada
-
 Chile
Chile
-
 China
China
-
 Colombia
-
 Congo
Congo
-
 Costa Rica
-
 Cote d'Ivoire
-
 Croatia
-
 Cuba
Cuba
-
 Cyprus
-
 Czechia
-
 DR Congo
-
 Denmark
-
 Dominican Republic
-
 Ecuador
-
 Egypt
Egypt
-
 El Salvador
-
 Estonia
-
 Eswatini
-
 Ethiopia
-
 Finland
-
 France
-
 Georgia
-
 Germany
-
 Ghana
Ghana
-
 Greece
-
 Haiti
Haiti
-
 Hong Kong
-
 Hungary
-
 India
India
-
 Indonesia
-
 Iran, Islamic republic
-
 Iraq
Iraq
-
 Ireland
-
 Israel
-
 Italy
Italy
-
 Jamaica
-
 Japan
Japan
-
 Jordan
-
 Kazakhstan
-
 Kenya
Kenya
-
 Korea
Korea
-
 Kuwait
-
 Kyrgyzstan
-
 Laos
Laos
-
 Latvia
-
 Lebanon
-
 Lesotho
-
 Libya
Libya
-
 Lithuania
-
 Luxembourg
-
 Madagascar
-
 Malaysia
-
 Malta
Malta
-
 Mauritius
-
 Mexico
-
 Moldova
-
 Mongolia
-
 Montenegro
-
 Morocco
-
 Mozambique
-
 Myanmar
-
 Namibia
-
 Nepal
Nepal
-
 Netherlands
-
 New Zealand
-
 Nigeria
-
 North Macedonia
-
 Norway
-
 Oman
Oman
-
 Pakistan
-
 Palestine
-
 Panama
-
 Papua New Guinea
-
 Paraguay
-
 Peru
Peru
-
 Philippines
-
 Poland
-
 Portugal
-
 Puerto Rico
-
 Qatar
Qatar
-
 Reunion
-
 Romania
-
 Rwanda
-
 Saudi Arabia
-
 Serbia
-
 Singapore
-
 Slovakia
-
 Slovenia
-
 Somalia
-
 South Africa
-
 Spain
Spain
-
 Sri Lanka
-
 Sweden
-
 Switzerland
-
 Syria
Syria
-
 Taiwan
-
 Tajikistan
-
 Tanzania
-
 Thailand
-
 Trinidad and Tobago
-
 Tunisia
-
 Turkey
-
 UAE
UAE
-
 Uganda
-
 Ukraine
-
 United Kingdom
-
United States
-
 Uruguay
-
 Uzbekistan
-
 Venezuela
-
 Vietnam
-
 Yemen
Yemen
-
 Zambia
-
 Zimbabwe
- Forex
- Crypto
