
Limited upside hampers DeXe as lack of buyers weighs on price action

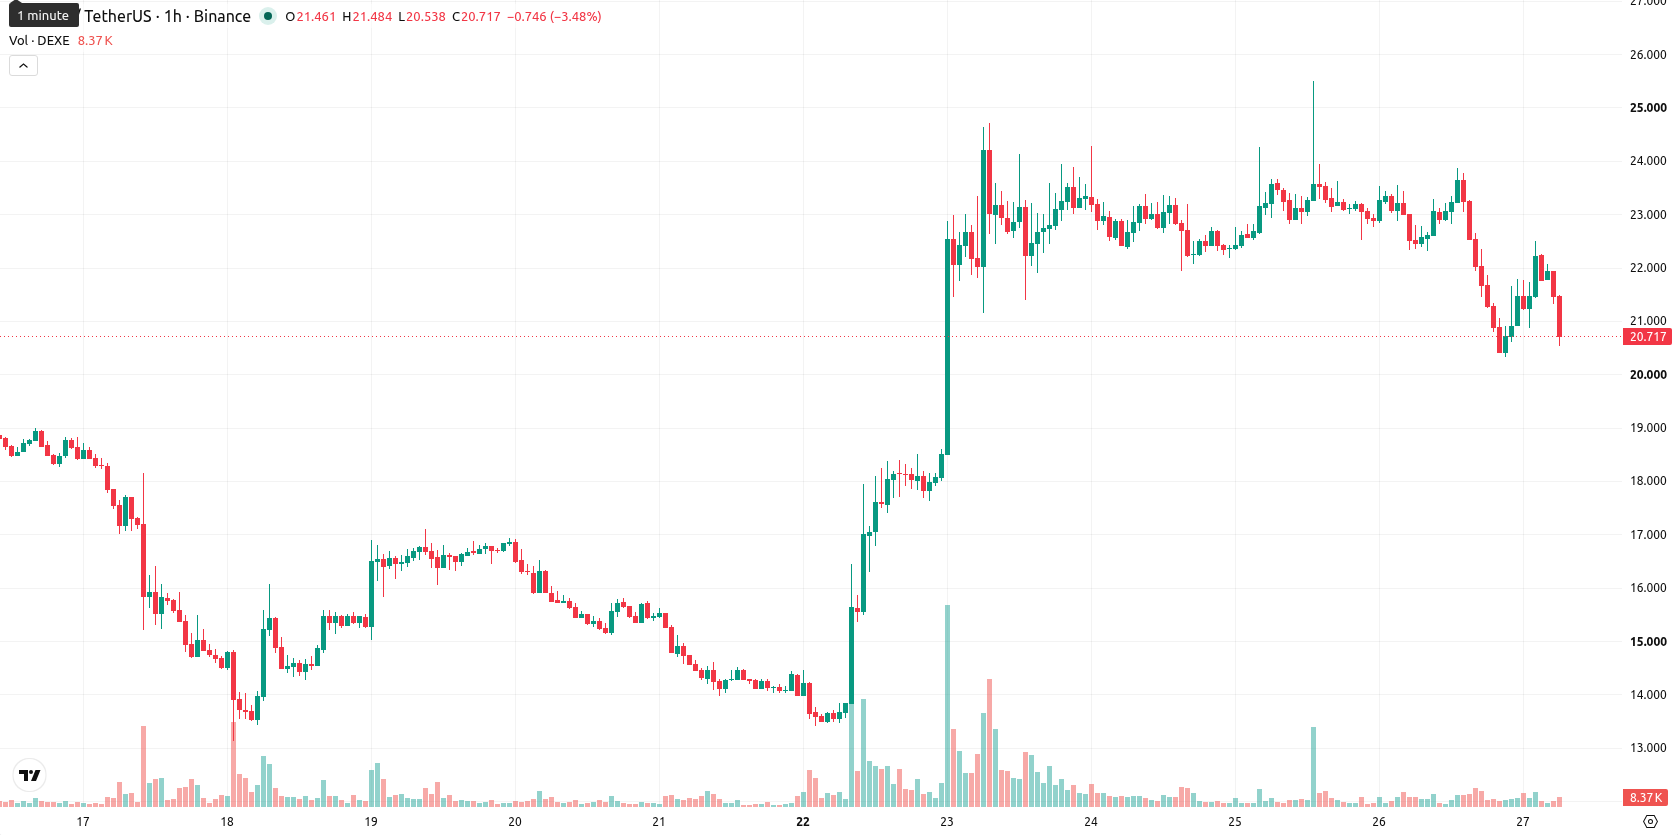
DeXe (DEXE) is trading at $20.69 after a daily decline of 8.3%. The asset is positioned below its key moving averages, reflecting persistent near-term selling pressure despite maintaining long-term support.
Highlights
- DEXE/USD remains under strong bearish momentum, with sellers dominating after an 8.3% drop to $20.69 and ongoing high volatility.
- Key technical signals—including low momentum and oscillator weakness—confirm a sustained downtrend, offset only by temporary intraday buying interest.
- Expected trading range for the next 2-3 days is $17.98 to $23.4, with a 79% probability of further decline.
Persistent weakness as short-term momentum and resistance dominate
DEXE/USD remains below its 20-day moving average at $21.91 and the 50-day moving average at $22.63, while long-term support remains intact above the 200-day moving average at $8.3. Immediate resistance is marked by the Ichimoku Kijun at $22.1. On the momentum front, the Moving Average Convergence Divergence (MACD) is on strong sell, the Average Directional Index (ADX) is neutral, and the Commodity Channel Index (CCI) is also neutral. The Relative Strength Index (RSI) prints 45.62, indicating weak buying interest, and the Stochastic RSI also signals strong sell. Bull/Bear Power registers in buy territory, pointing to some intraday buyer activity, while the Awesome Oscillator is neutral, confirming no clear counter-trend momentum.
Sideways bias as volatility persists and upside remains limited
Over the next 2-3 days, DEXE is expected to trade within a $17.98 to $23.4 range, reflecting typical volatility. The probability model suggests a 21% chance of upside versus a 79% likelihood of continued decline. The baseline scenario calls for sideways consolidation within this band, with bullish momentum requiring a decisive move above the $22.1 Kijun resistance, while a break below $17.98 would reinforce the current downward bias.
Earlier, analysts noted that DeXe was exhibiting heightened volatility and directional uncertainty amid persistent selling pressure and key inflection points. The current technical picture increases the likelihood of further downside within the established range, making a close watch on the $17.98 lower boundary critical for traders assessing potential breakdown risk.


-
 Afghanistan
-
 Albania
-
 Algeria
-
 Angola
-
 Argentina
-
 Armenia
-
 Australia
-
 Austria
-
 Azerbaijan
-
 Bahamas
-
 Bahrain
-
 Bangladesh
-
 Belarus
-
 Belgium
-
 Bolivia
-
 Botswana
-
 Brazil
-
 Brunei
-
 Bulgaria
-
 Cambodia
-
 Cameroon
-
 Canada
-
 Chile
Chile
-
 China
China
-
 Colombia
-
 Congo
Congo
-
 Costa Rica
-
 Cote d'Ivoire
-
 Croatia
-
 Cuba
Cuba
-
 Cyprus
-
 Czechia
-
 DR Congo
-
 Denmark
-
 Dominican Republic
-
 Ecuador
-
 Egypt
Egypt
-
 El Salvador
-
 Estonia
-
 Eswatini
-
 Ethiopia
-
 Finland
-
 France
-
 Georgia
-
 Germany
-
 Ghana
Ghana
-
 Greece
-
 Haiti
Haiti
-
 Hong Kong
-
 Hungary
-
 India
India
-
 Indonesia
-
 Iran, Islamic republic
-
 Iraq
Iraq
-
 Ireland
-
 Israel
-
 Italy
Italy
-
 Jamaica
-
 Japan
Japan
-
 Jordan
-
 Kazakhstan
-
 Kenya
Kenya
-
 Korea
Korea
-
 Kuwait
-
 Kyrgyzstan
-
 Laos
Laos
-
 Latvia
-
 Lebanon
-
 Lesotho
-
 Libya
Libya
-
 Lithuania
-
 Luxembourg
-
 Madagascar
-
 Malaysia
-
 Malta
Malta
-
 Mauritius
-
 Mexico
-
 Moldova
-
 Mongolia
-
 Montenegro
-
 Morocco
-
 Mozambique
-
 Myanmar
-
 Namibia
-
 Nepal
Nepal
-
 Netherlands
-
 New Zealand
-
 Nigeria
-
 North Macedonia
-
 Norway
-
 Oman
Oman
-
 Pakistan
-
 Palestine
-
 Panama
-
 Papua New Guinea
-
 Paraguay
-
 Peru
Peru
-
 Philippines
-
 Poland
-
 Portugal
-
 Puerto Rico
-
 Qatar
Qatar
-
 Reunion
-
 Romania
-
 Rwanda
-
 Saudi Arabia
-
 Serbia
-
 Singapore
-
 Slovakia
-
 Slovenia
-
 Somalia
-
 South Africa
-
 Spain
Spain
-
 Sri Lanka
-
 Sweden
-
 Switzerland
-
 Syria
Syria
-
 Taiwan
-
 Tajikistan
-
 Tanzania
-
 Thailand
-
 Trinidad and Tobago
-
 Tunisia
-
 Turkey
-
 UAE
UAE
-
 Uganda
-
 Ukraine
-
 United Kingdom
-
United States
-
 Uruguay
-
 Uzbekistan
-
 Venezuela
-
 Vietnam
-
 Yemen
Yemen
-
 Zambia
-
 Zimbabwe
- Forex
- Crypto
