
DeXe jumps 8.96% as DAO infrastructure launch with transparent governance fuels optimism

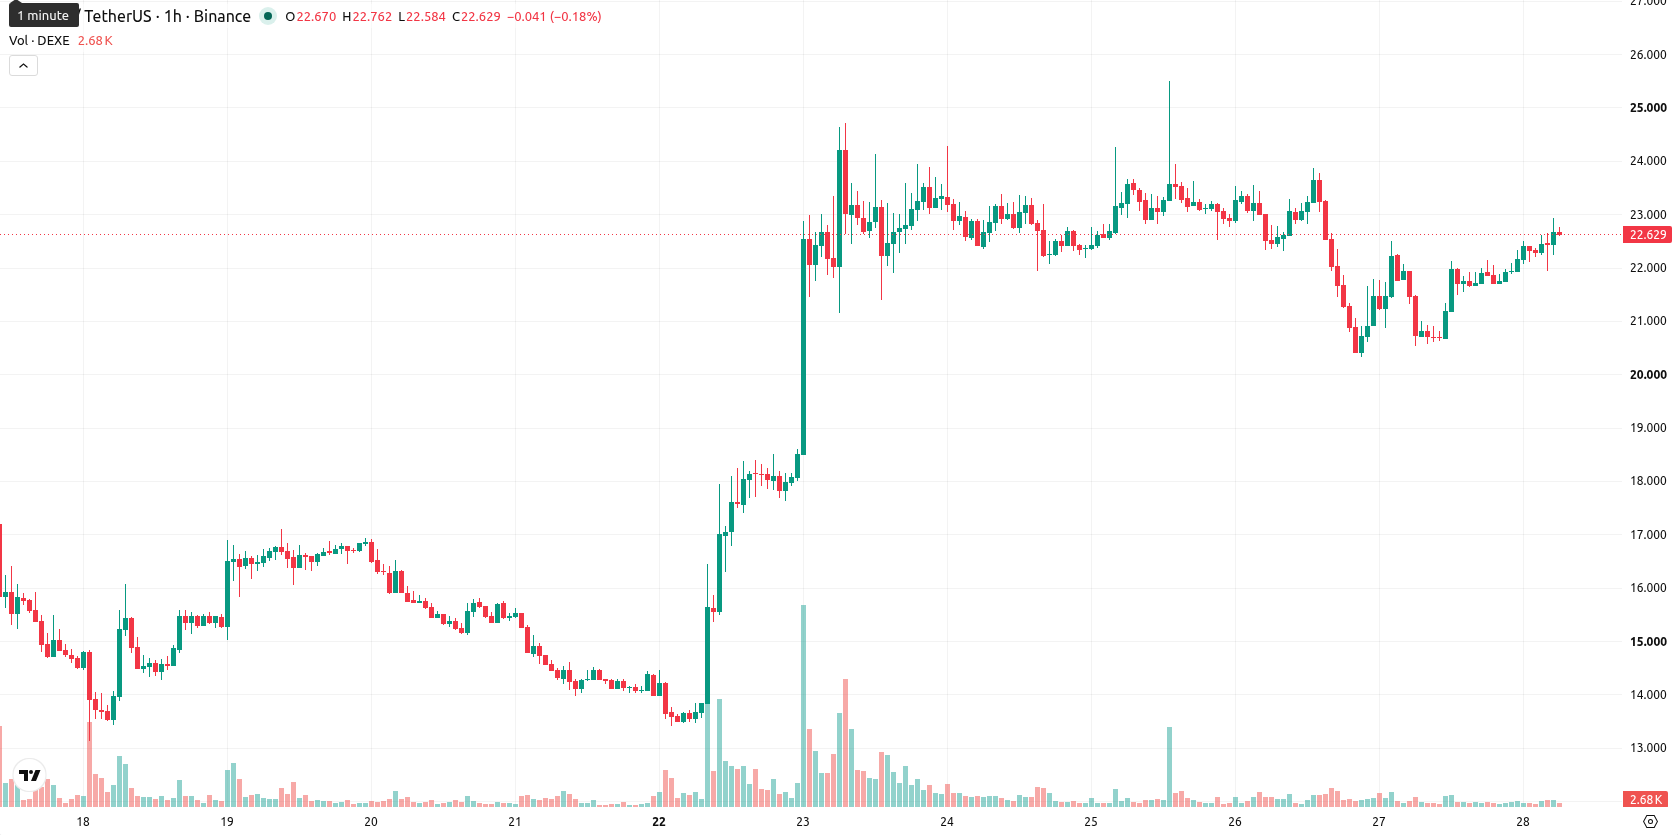
DeXe (DEXE) is trading at $22.66, showing an 8.96% gain on the day and sitting above its key moving averages. The strong upward movement has pushed the token into an area of robust momentum relative to recent trend benchmarks.
Highlights
- DeXe enables institutional-focused DAOs with infrastructure for transparent, on-chain governance and multi-chain treasury management in the Web3 sector.
- DEXE token’s utility for access, governance, and incentive alignment links platform adoption directly to token demand growth.
- DEXE/USD displays strong bullish momentum, trading in the $19.95–$25.63 range, with overbought signals suggesting possible short-term consolidation or pullback risk.
Token demand rises as protocol adoption drives DAO activity
DeXe has established itself as a decentralized protocol delivering infrastructure for decentralized autonomous organizations (DAOs), with solutions centered on transparent, on-chain governance and multi-chain treasury management, according to Crypto Economy. These operational features directly enable DAOs to manage assets and participate in decision-making, driving institutional-grade adoption within the Web3 ecosystem. The DEXE token acts as the primary vehicle for access, governance, and incentive alignment, linking increased platform usage to rising demand for the token.
Overbought signals intensify despite ongoing bullish momentum
On the hourly chart, DEXE/USD is trading above the 20-period and 50-period moving averages, with price also well above the 200-period moving average. The Ichimoku Kijun provides immediate support at $21.74. The Moving Average Convergence Divergence (MACD) is in buy mode, indicating that momentum remains bullish, while the Average Directional Index (ADX) does not confirm a strong trend. The Relative Strength Index (RSI) stands at 65.58, in buy territory, and both the Commodity Channel Index (CCI) and Stochastic RSI are in overbought levels, suggesting short-term exuberance. Bull/Bear Power is also overbought, showing notable buyer dominance, and the Awesome Oscillator is bullish. Taken together, the indicator set signals a powerful upward move but with increasing risks of a pullback given the overbought readings.
Upside favored as trading range narrows amid high volatility
In the short term, the expected trading range for DEXE/USD is $19.95 to $25.63, reflecting typical volatility for the next 2–3 days. There is a very high probability that price will continue to the upside, with a low likelihood of a downward move. The baseline scenario calls for consolidation within the current range, while a bullish breakout above resistance could see further gains. Alternatively, a fall below immediate support would open the door to a sharper retracement.
Earlier, analysts noted that DeXe faced heightened volatility and directional uncertainty, with technicals presenting a bullish bias tempered by risks of exhaustion. The latest momentum surge and overbought signals reinforce the persistence of elevated volatility, making monitoring for signs of a sharp pullback or breakout outside the $19.95–$25.63 range critical for near-term positioning.


-
 Afghanistan
-
 Albania
-
 Algeria
-
 Angola
-
 Argentina
-
 Armenia
-
 Australia
-
 Austria
-
 Azerbaijan
-
 Bahamas
-
 Bahrain
-
 Bangladesh
-
 Belarus
-
 Belgium
-
 Bolivia
-
 Botswana
-
 Brazil
-
 Brunei
-
 Bulgaria
-
 Cambodia
-
 Cameroon
-
 Canada
-
 Chile
Chile
-
 China
China
-
 Colombia
-
 Congo
Congo
-
 Costa Rica
-
 Cote d'Ivoire
-
 Croatia
-
 Cuba
Cuba
-
 Cyprus
-
 Czechia
-
 DR Congo
-
 Denmark
-
 Dominican Republic
-
 Ecuador
-
 Egypt
Egypt
-
 El Salvador
-
 Estonia
-
 Eswatini
-
 Ethiopia
-
 Finland
-
 France
-
 Georgia
-
 Germany
-
 Ghana
Ghana
-
 Greece
-
 Haiti
Haiti
-
 Hong Kong
-
 Hungary
-
 India
India
-
 Indonesia
-
 Iran, Islamic republic
-
 Iraq
Iraq
-
 Ireland
-
 Israel
-
 Italy
Italy
-
 Jamaica
-
 Japan
Japan
-
 Jordan
-
 Kazakhstan
-
 Kenya
Kenya
-
 Korea
Korea
-
 Kuwait
-
 Kyrgyzstan
-
 Laos
Laos
-
 Latvia
-
 Lebanon
-
 Lesotho
-
 Libya
Libya
-
 Lithuania
-
 Luxembourg
-
 Madagascar
-
 Malaysia
-
 Malta
Malta
-
 Mauritius
-
 Mexico
-
 Moldova
-
 Mongolia
-
 Montenegro
-
 Morocco
-
 Mozambique
-
 Myanmar
-
 Namibia
-
 Nepal
Nepal
-
 Netherlands
-
 New Zealand
-
 Nigeria
-
 North Macedonia
-
 Norway
-
 Oman
Oman
-
 Pakistan
-
 Palestine
-
 Panama
-
 Papua New Guinea
-
 Paraguay
-
 Peru
Peru
-
 Philippines
-
 Poland
-
 Portugal
-
 Puerto Rico
-
 Qatar
Qatar
-
 Reunion
-
 Romania
-
 Rwanda
-
 Saudi Arabia
-
 Serbia
-
 Singapore
-
 Slovakia
-
 Slovenia
-
 Somalia
-
 South Africa
-
 Spain
Spain
-
 Sri Lanka
-
 Sweden
-
 Switzerland
-
 Syria
Syria
-
 Taiwan
-
 Tajikistan
-
 Tanzania
-
 Thailand
-
 Trinidad and Tobago
-
 Tunisia
-
 Turkey
-
 UAE
UAE
-
 Uganda
-
 Ukraine
-
 United Kingdom
-
United States
-
 Uruguay
-
 Uzbekistan
-
 Venezuela
-
 Vietnam
-
 Yemen
Yemen
-
 Zambia
-
 Zimbabwe
- Forex
- Crypto
