
Sonic extends gains as price stays above short and mid-term averages

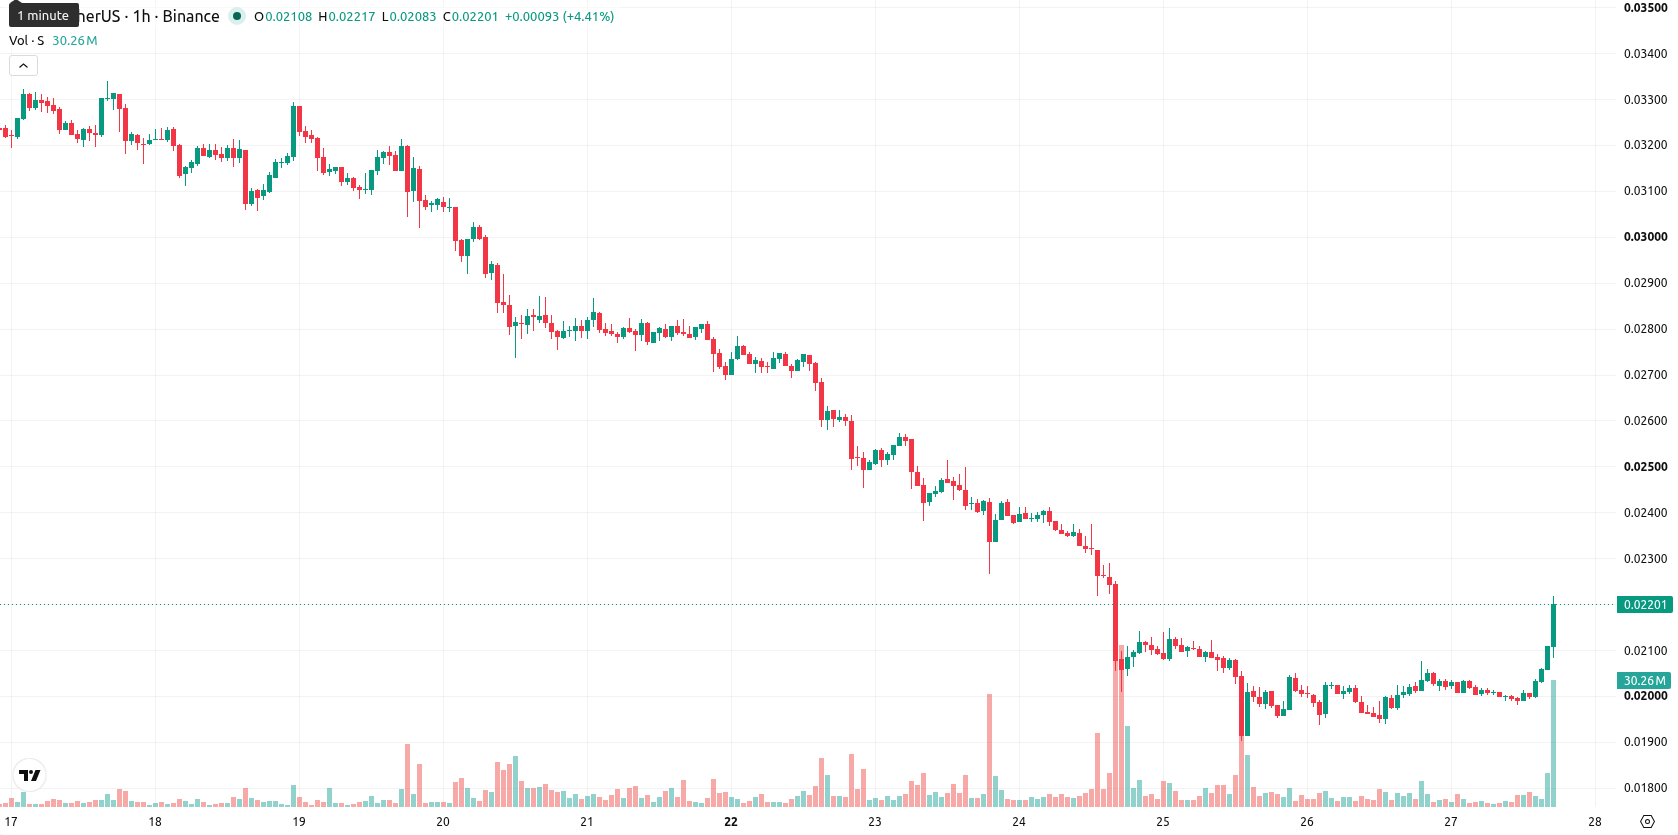
Sonic (S) is trading at $0.0218 today, up 8.47% from the previous session. The price sits above its key short-term and medium-term moving averages, reflecting strong bullish momentum within the day.
Highlights
- Short- and medium-term momentum is bullish, but the longer-term trend remains under clear selling pressure.
- Technical indicators confirm strong buyer activity, though overbought signals suggest momentum may be stretched near current highs.
- Price is expected to consolidate between $0.0196 and $0.024, with a 62% probability of an upside breakout.
Momentum divergence as overbought signals meet volatile trend
On the technical front, S is holding above the 20-period ($0.0202) and 50-period ($0.0201) moving averages on the hourly chart, while it remains well below the 200-period moving average ($0.0518) on the daily timeframe. Immediate support is seen at the Ichimoku Kijun level of $0.0204. The Moving Average Convergence Divergence (MACD) and Average Directional Index (ADX) both indicate buy signals at current levels. The Relative Strength Index (RSI) is at 65.53—signaling buying momentum—while Stochastic RSI and Commodity Channel Index (CCI) readings are overbought. Bull/Bear Power reflects buyer dominance, but the Awesome Oscillator is neutral, pointing to a divergence between momentum and trend strength as intraday volatility remains high.
Range-bound outlook as breakout and downside risks loom
Over the next one to two trading days, the likely trading range for S is $0.0196 to $0.024, with a forecasted probability of 62% for an upward move and 38% for a downward turn. The baseline scenario suggests consolidation within this volatility band. A breakout above resistance could see S target the upper zone of the projected range, while a drop below support at $0.0204 may accelerate movement toward the lower boundary.
Earlier, analysts noted that Sonic was facing ongoing bearish pressure, with a broadly negative technical outlook dominating the short-term view. The current recovery signals a potential shift toward bullish momentum, with the balance of technical signals suggesting traders should monitor for a sustained hold above immediate support at $0.0204 to confirm improved sentiment.


-
 Afghanistan
-
 Albania
-
 Algeria
-
 Angola
-
 Argentina
-
 Armenia
-
 Australia
-
 Austria
-
 Azerbaijan
-
 Bahamas
-
 Bahrain
-
 Bangladesh
-
 Belarus
-
 Belgium
-
 Bolivia
-
 Botswana
-
 Brazil
-
 Brunei
-
 Bulgaria
-
 Cambodia
-
 Cameroon
-
 Canada
-
 Chile
Chile
-
 China
China
-
 Colombia
-
 Congo
Congo
-
 Costa Rica
-
 Cote d'Ivoire
-
 Croatia
-
 Cuba
Cuba
-
 Cyprus
-
 Czechia
-
 DR Congo
-
 Denmark
-
 Dominican Republic
-
 Ecuador
-
 Egypt
Egypt
-
 El Salvador
-
 Estonia
-
 Eswatini
-
 Ethiopia
-
 Finland
-
 France
-
 Georgia
-
 Germany
-
 Ghana
Ghana
-
 Greece
-
 Haiti
Haiti
-
 Hong Kong
-
 Hungary
-
 India
India
-
 Indonesia
-
 Iran, Islamic republic
-
 Iraq
Iraq
-
 Ireland
-
 Israel
-
 Italy
Italy
-
 Jamaica
-
 Japan
Japan
-
 Jordan
-
 Kazakhstan
-
 Kenya
Kenya
-
 Korea
Korea
-
 Kuwait
-
 Kyrgyzstan
-
 Laos
Laos
-
 Latvia
-
 Lebanon
-
 Lesotho
-
 Libya
Libya
-
 Lithuania
-
 Luxembourg
-
 Madagascar
-
 Malaysia
-
 Malta
Malta
-
 Mauritius
-
 Mexico
-
 Moldova
-
 Mongolia
-
 Montenegro
-
 Morocco
-
 Mozambique
-
 Myanmar
-
 Namibia
-
 Nepal
Nepal
-
 Netherlands
-
 New Zealand
-
 Nigeria
-
 North Macedonia
-
 Norway
-
 Oman
Oman
-
 Pakistan
-
 Palestine
-
 Panama
-
 Papua New Guinea
-
 Paraguay
-
 Peru
Peru
-
 Philippines
-
 Poland
-
 Portugal
-
 Puerto Rico
-
 Qatar
Qatar
-
 Reunion
-
 Romania
-
 Rwanda
-
 Saudi Arabia
-
 Serbia
-
 Singapore
-
 Slovakia
-
 Slovenia
-
 Somalia
-
 South Africa
-
 Spain
Spain
-
 Sri Lanka
-
 Sweden
-
 Switzerland
-
 Syria
Syria
-
 Taiwan
-
 Tajikistan
-
 Tanzania
-
 Thailand
-
 Trinidad and Tobago
-
 Tunisia
-
 Turkey
-
 UAE
UAE
-
 Uganda
-
 Ukraine
-
 United Kingdom
-
United States
-
 Uruguay
-
 Uzbekistan
-
 Venezuela
-
 Vietnam
-
 Yemen
Yemen
-
 Zambia
-
 Zimbabwe
- Forex
- Crypto
