
Solana price prediction: Will $68.07 support hold as SOL loses 1.78%?

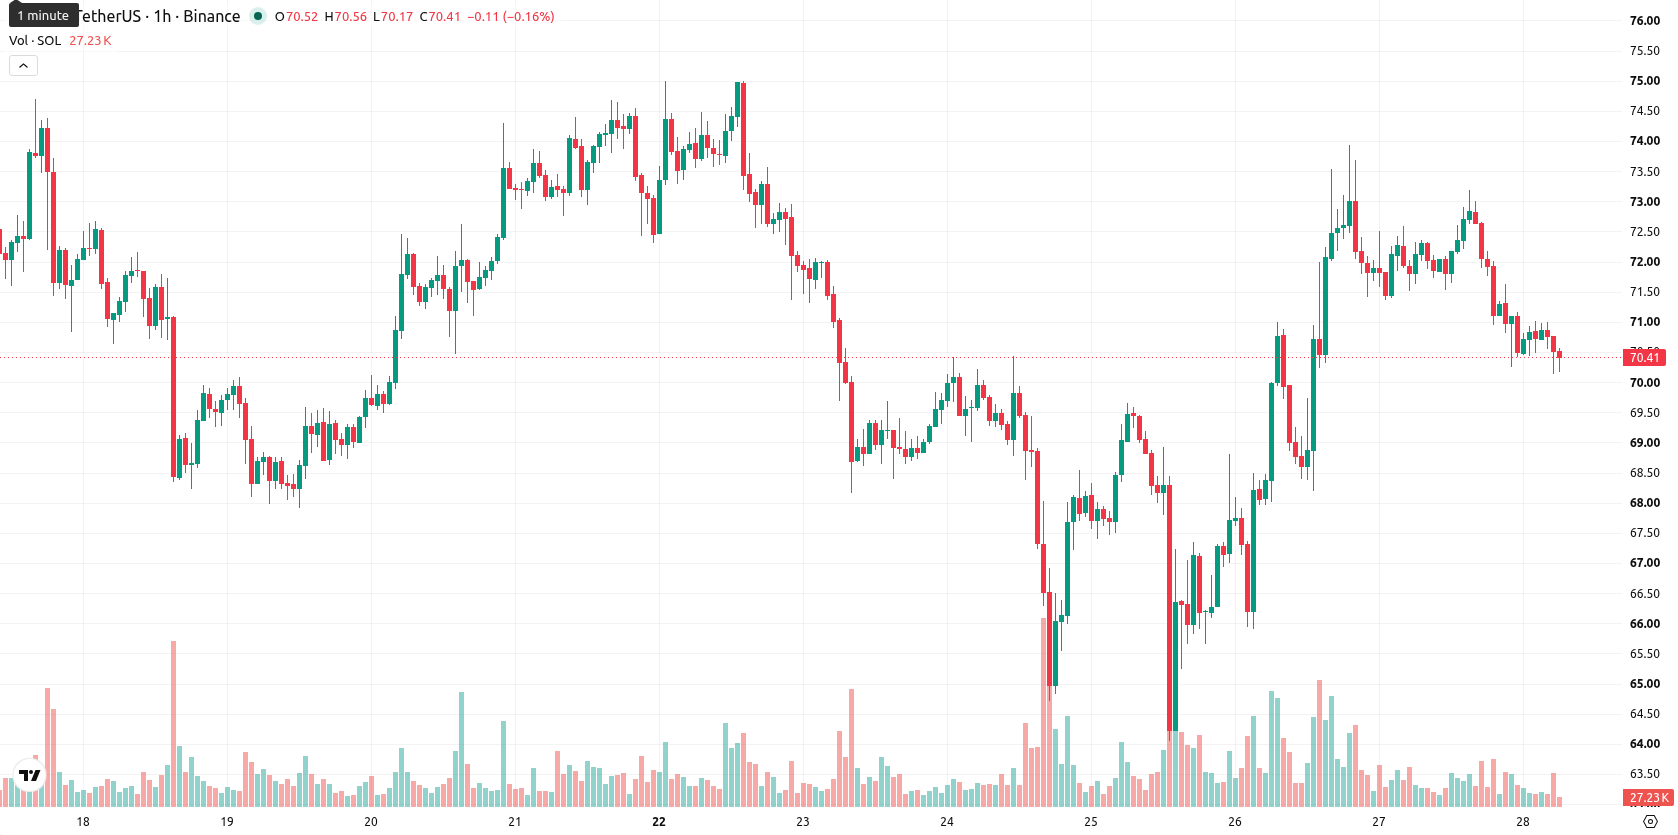
Solana (SOL) is trading at $70.52, down 1.78% for the day and sitting near the daily low. The price is currently positioned below its key moving averages on the hourly and longer-term timeframes.
Highlights
- Tokenized stock trading volume on Solana hit a record $553 million on June 27, 2026, driven by institutional flows and ETF launches.
- Despite rising tokenized equity market share and a notable open interest uptick, Solana faces continued selling pressure and declining DeFi activity.
- SOL/USD trades below key moving averages with bearish momentum; expected 2–3 day range is $68.07 to $72.97 as downside risk prevails.
Institutional activity expands as tokenized equities rise despite selling
Daily tokenized stock trading volume on Solana reached a record $553 million on June 27, 2026, marking the highest on-chain activity for real-world asset issuance to date, according to En Coin Turk. The launch of Kazakhstan's Solana-based ETF SOLZ_KZ introduced a new regulated access point for institutional and retail investors, as reported by Cryptonews. Data from Newsbtc highlighted a decline in Solana's total value locked and decentralized exchange volumes despite its rising share in tokenized equities, while Coingape noted a 10% increase in open interest reflecting heightened participation from futures traders. These developments signal strong institutional engagement, though price action has remained under broader selling pressure.
Momentum wanes as technical barriers limit recovery attempts
SOL/USD trades below the 20-period moving average at $71.57 and the 50-period moving average at $71.23 on the hourly chart, with the long-term 200-period moving average well above at $95.51. The Ichimoku Kijun sits at $71.72 and acts as immediate resistance. Momentum signals are predominantly weak: the Moving Average Convergence Divergence (MACD) issues a sell signal, Average Directional Index (ADX) is neutral, and the Commodity Channel Index (CCI) points to sell. The Relative Strength Index (RSI) is subdued at 44.36, while Stochastic RSI and Awesome Oscillator remain neutral. Bull/Bear Power indicates sellers are dominant, entering oversold territory, and volatility is subdued with price gapping lower near daily lows.
Consolidation likely as downside risks outpace bullish breakouts
Over the next two to three trading days, SOL/USD is expected to fluctuate within a typical volatility band between $68.07 and $72.97. The likelihood of an upward move is estimated at 32%, while downside probability is higher at 68%. The baseline view is that price will consolidate within this corridor, with a bullish scenario requiring a sustained break above the $71.72 resistance level. Further weakness may develop if the price slips below support near $68.07.
Earlier, analysts noted that Solana’s narrative was bolstered by increasing institutional participation and technological adoption, but faced caution due to persistent selling pressure. The present market backdrop reinforces this cautious outlook, with suppressed momentum and dominant sellers making a decisive move above the $71.72 resistance level the clearest sign of any near-term reversal.


-
 Afghanistan
-
 Albania
-
 Algeria
-
 Angola
-
 Argentina
-
 Armenia
-
 Australia
-
 Austria
-
 Azerbaijan
-
 Bahamas
-
 Bahrain
-
 Bangladesh
-
 Belarus
-
 Belgium
-
 Bolivia
-
 Botswana
-
 Brazil
-
 Brunei
-
 Bulgaria
-
 Cambodia
-
 Cameroon
-
 Canada
-
 Chile
Chile
-
 China
China
-
 Colombia
-
 Congo
Congo
-
 Costa Rica
-
 Cote d'Ivoire
-
 Croatia
-
 Cuba
Cuba
-
 Cyprus
-
 Czechia
-
 DR Congo
-
 Denmark
-
 Dominican Republic
-
 Ecuador
-
 Egypt
Egypt
-
 El Salvador
-
 Estonia
-
 Eswatini
-
 Ethiopia
-
 Finland
-
 France
-
 Georgia
-
 Germany
-
 Ghana
Ghana
-
 Greece
-
 Haiti
Haiti
-
 Hong Kong
-
 Hungary
-
 India
India
-
 Indonesia
-
 Iran, Islamic republic
-
 Iraq
Iraq
-
 Ireland
-
 Israel
-
 Italy
Italy
-
 Jamaica
-
 Japan
Japan
-
 Jordan
-
 Kazakhstan
-
 Kenya
Kenya
-
 Korea
Korea
-
 Kuwait
-
 Kyrgyzstan
-
 Laos
Laos
-
 Latvia
-
 Lebanon
-
 Lesotho
-
 Libya
Libya
-
 Lithuania
-
 Luxembourg
-
 Madagascar
-
 Malaysia
-
 Malta
Malta
-
 Mauritius
-
 Mexico
-
 Moldova
-
 Mongolia
-
 Montenegro
-
 Morocco
-
 Mozambique
-
 Myanmar
-
 Namibia
-
 Nepal
Nepal
-
 Netherlands
-
 New Zealand
-
 Nigeria
-
 North Macedonia
-
 Norway
-
 Oman
Oman
-
 Pakistan
-
 Palestine
-
 Panama
-
 Papua New Guinea
-
 Paraguay
-
 Peru
Peru
-
 Philippines
-
 Poland
-
 Portugal
-
 Puerto Rico
-
 Qatar
Qatar
-
 Reunion
-
 Romania
-
 Rwanda
-
 Saudi Arabia
-
 Serbia
-
 Singapore
-
 Slovakia
-
 Slovenia
-
 Somalia
-
 South Africa
-
 Spain
Spain
-
 Sri Lanka
-
 Sweden
-
 Switzerland
-
 Syria
Syria
-
 Taiwan
-
 Tajikistan
-
 Tanzania
-
 Thailand
-
 Trinidad and Tobago
-
 Tunisia
-
 Turkey
-
 UAE
UAE
-
 Uganda
-
 Ukraine
-
 United Kingdom
-
United States
-
 Uruguay
-
 Uzbekistan
-
 Venezuela
-
 Vietnam
-
 Yemen
Yemen
-
 Zambia
-
 Zimbabwe
- Forex
- Crypto
