

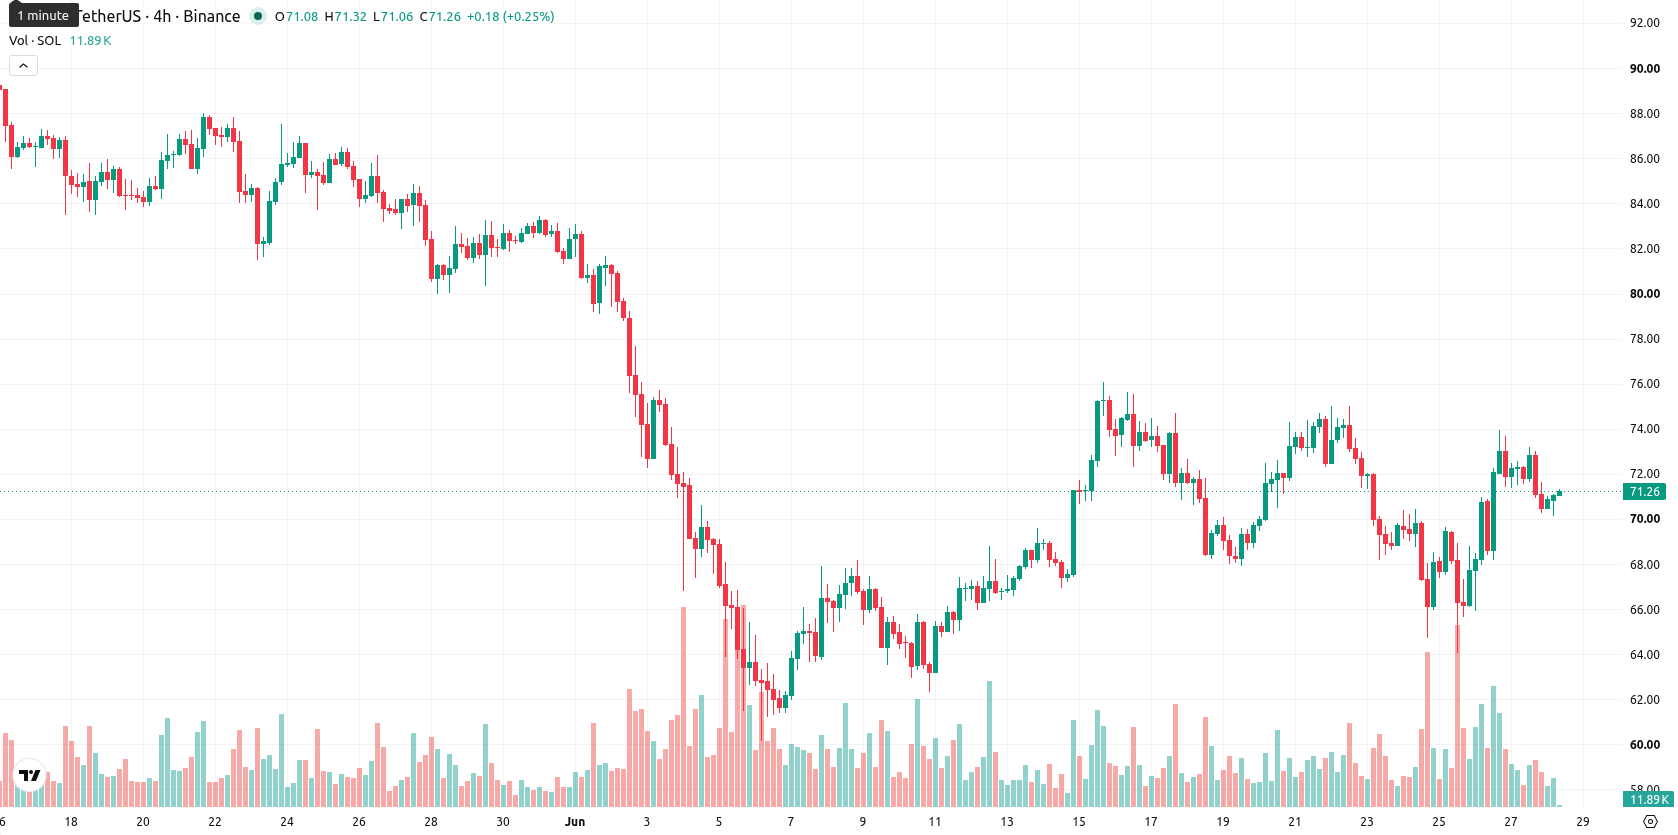
Solana (SOL) is trading at $71.08, down 1.7% on the day. The asset holds above its short- and medium-term moving averages while remaining below its key long-term average, with price near the upper part of today’s range amid moderate volatility.
Highlights
- SEC's classification of Solana as a potential unregistered security limits institutional inflows and excludes it from U.S. ETF eligibility.
- European MiCA rules now require crypto firms engaging with Solana to obtain licenses, increasing compliance costs and regulatory scrutiny.
- SOL/USD faces a projected short-term range of $62.42 to $75.98, with mixed technical signals and higher probability of an upward move.
Institutional flows curbed as regulation heightens risks and costs
The U.S. Securities and Exchange Commission previously classified Solana as a potential unregistered security, a regulatory action that directly restricts institutional participation and excludes the network from ETF consideration, dampening large-scale investment flows. In parallel, the full enforcement of MiCA across Europe now obliges crypto firms engaging with Solana to secure proper licenses, altering the network’s regulatory landscape and introducing additional compliance costs. Meanwhile, surging tokenized equity volumes and heightened activity in real-world asset tokenization on Solana reflect growing blockchain adoption, though regulatory concerns continue to be actively monitored, as reported by En Coin Turk.
Diverging momentum signals as technicals clash at key support
Technically, SOL/USD is trading above its MA-20 and MA-50 but remains below the MA-200. The Ichimoku Kijun at $68.99 serves as immediate support for current price action. The Moving Average Convergence Divergence (MACD) displays bullish momentum, while the Average Directional Index (ADX) is Neutral, signaling moderate trend strength without a clear directional conviction. The Relative Strength Index (RSI) stands at 51.1, reflecting a Buy signal, but both the Stochastic RSI and Commodity Channel Index (CCI) are Neutral, underscoring mixed overbought or oversold signals. Bull/Bear Power is Oversold, indicating short-term seller dominance, while the Awesome Oscillator is Neutral and does not reinforce a clear direction. Momentum and oscillators present a divergence, with the MACD and RSI showing some buying interest, countered by the bearish reading from Bull/Bear Power.
Contained volatility expected as breakout and breakdown risks loom
Looking ahead to the next two to three trading days, SOL/USD is projected to fluctuate within a range of $62.42 to $75.98, reflecting typical volatility for the asset. There is a 63% probability of an upward move, with the base scenario expecting prices to remain contained within this band. A bullish breakout above $75.98 would open the door to further gains, while a decline below immediate support at $68.99 could set the stage for a move toward the lower end near $62.42.
Earlier, analysts noted that Solana was experiencing strong institutional engagement and technological adoption but remained under the grip of persistent selling pressure. The current technical setup, coupled with evolving regulatory hurdles, underscores the importance of monitoring a breakout above $75.98 as a potential trigger for renewed bullish momentum in the coming sessions.


Latest Solana News


-
 Afghanistan
-
 Albania
-
 Algeria
-
 Angola
-
 Argentina
-
 Armenia
-
 Australia
-
 Austria
-
 Azerbaijan
-
 Bahamas
-
 Bahrain
-
 Bangladesh
-
 Belarus
-
 Belgium
-
 Bolivia
-
 Botswana
-
 Brazil
-
 Brunei
-
 Bulgaria
-
 Cambodia
-
 Cameroon
-
 Canada
-
 Chile
Chile
-
 China
China
-
 Colombia
-
 Congo
Congo
-
 Costa Rica
-
 Cote d'Ivoire
-
 Croatia
-
 Cuba
Cuba
-
 Cyprus
-
 Czechia
-
 DR Congo
-
 Denmark
-
 Dominican Republic
-
 Ecuador
-
 Egypt
Egypt
-
 El Salvador
-
 Estonia
-
 Eswatini
-
 Ethiopia
-
 Finland
-
 France
-
 Georgia
-
 Germany
-
 Ghana
Ghana
-
 Greece
-
 Haiti
Haiti
-
 Hong Kong
-
 Hungary
-
 India
India
-
 Indonesia
-
 Iran, Islamic republic
-
 Iraq
Iraq
-
 Ireland
-
 Israel
-
 Italy
Italy
-
 Jamaica
-
 Japan
Japan
-
 Jordan
-
 Kazakhstan
-
 Kenya
Kenya
-
 Korea
Korea
-
 Kuwait
-
 Kyrgyzstan
-
 Laos
Laos
-
 Latvia
-
 Lebanon
-
 Lesotho
-
 Libya
Libya
-
 Lithuania
-
 Luxembourg
-
 Madagascar
-
 Malaysia
-
 Malta
Malta
-
 Mauritius
-
 Mexico
-
 Moldova
-
 Mongolia
-
 Montenegro
-
 Morocco
-
 Mozambique
-
 Myanmar
-
 Namibia
-
 Nepal
Nepal
-
 Netherlands
-
 New Zealand
-
 Nigeria
-
 North Macedonia
-
 Norway
-
 Oman
Oman
-
 Pakistan
-
 Palestine
-
 Panama
-
 Papua New Guinea
-
 Paraguay
-
 Peru
Peru
-
 Philippines
-
 Poland
-
 Portugal
-
 Puerto Rico
-
 Qatar
Qatar
-
 Reunion
-
 Romania
-
 Rwanda
-
 Saudi Arabia
-
 Serbia
-
 Singapore
-
 Slovakia
-
 Slovenia
-
 Somalia
-
 South Africa
-
 Spain
Spain
-
 Sri Lanka
-
 Sweden
-
 Switzerland
-
 Syria
Syria
-
 Taiwan
-
 Tajikistan
-
 Tanzania
-
 Thailand
-
 Trinidad and Tobago
-
 Tunisia
-
 Turkey
-
 UAE
UAE
-
 Uganda
-
 Ukraine
-
 United Kingdom
-
United States
-
 Uruguay
-
 Uzbekistan
-
 Venezuela
-
 Vietnam
-
 Yemen
Yemen
-
 Zambia
-
 Zimbabwe
- Forex
- Crypto
