
XRP price prediction: Will $1.0071–$1.0762 range hold? XRP trades flat

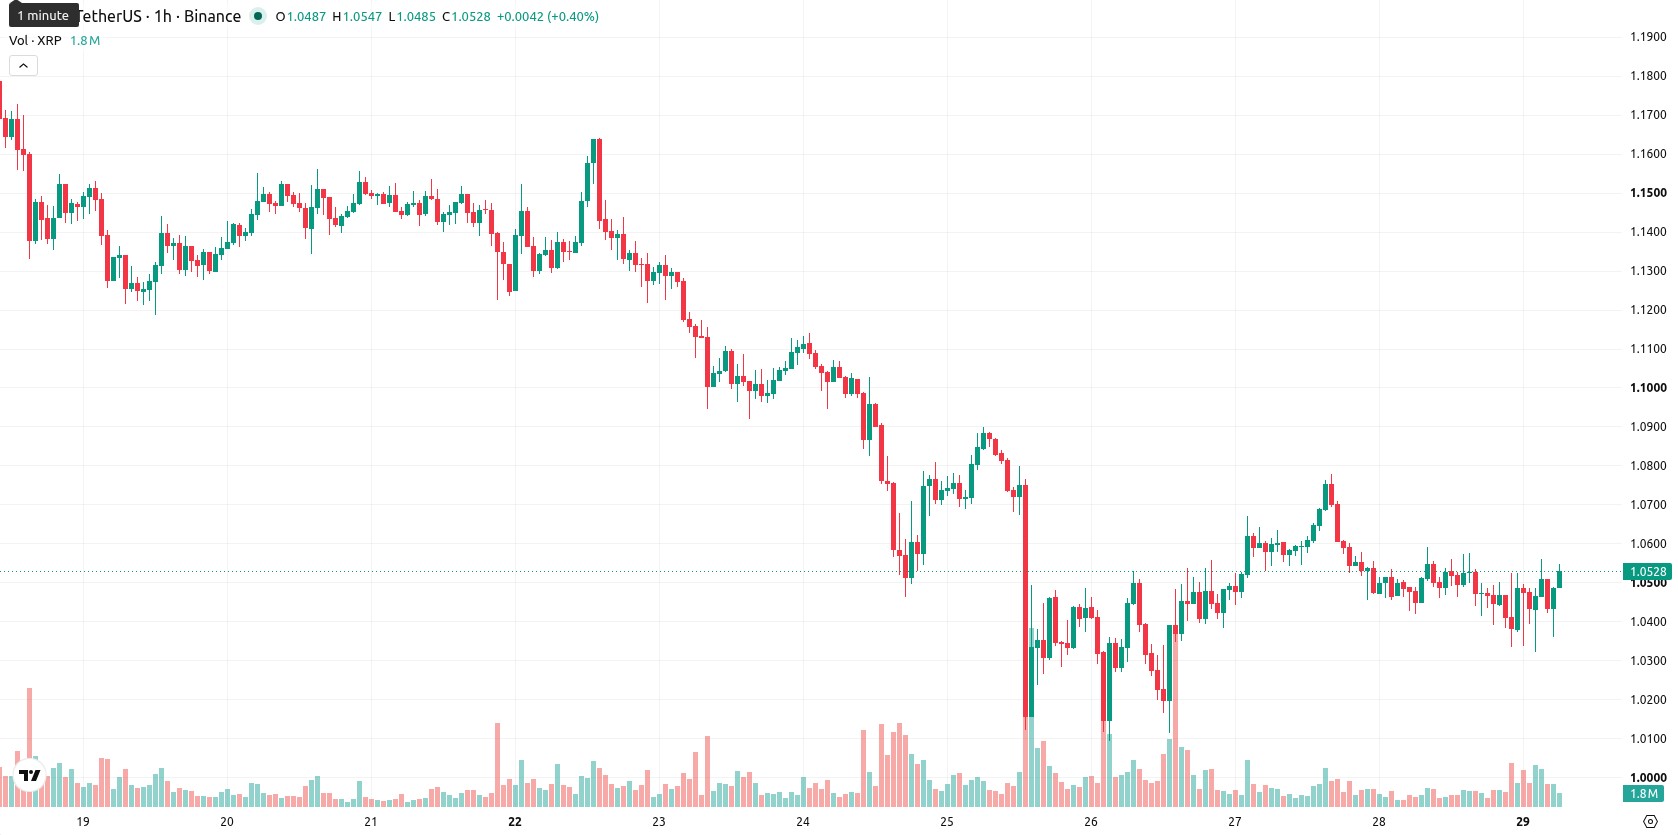
XRP (XRP) is trading at $1.0483 after a marginal gain intraday. The price currently sits above its key short-term moving average but remains below both medium- and long-term averages.
Highlights
- XRP spot ETFs logged seven consecutive weeks of net inflows totaling $144.69 million, indicating strong institutional demand momentum.
- Ripple's RLUSD stablecoin is handling major institutional settlements, including transactions with JPMorgan and Mastercard, subtly shifting demand away from XRP.
- Technical signals lean bearish, with XRP/USD expected to trade between $1.0071 and $1.0762 over 2–3 days; upside probability remains low.
Institutional ETF inflows rise as RLUSD adoption shifts demand channels
XRP continues to see consistent institutional inflows, with XRP spot ETFs recording seven consecutive weeks of net purchases totaling about $144.69 million, according to SoSoValue as cited by Crypto. These persistent inflows are reinforced by a daily net addition of $15.63 million on June 26, with Pluang reporting cumulative ETF inflows reaching $1.47 billion. Meanwhile, Ripple's RLUSD stablecoin is being adopted in major institutional settlements, including recent deals with JPMorgan and Mastercard, which shifts traditional demand channels away from XRP itself. The launch of RLUSD in Japan through SBI VC Trade broadens Ripple's regulated presence in Asia but does not directly influence short-term XRP trading dynamics.
Bearish momentum persists amid neutral trend strength and technical divergence
XRP is currently positioned above its 20-day moving average, while remaining beneath both its 50-day and 200-day moving averages. The Ichimoku Kijun level at $1.0457 acts as the first support zone. A neutral Average Directional Index (ADX) reflects a lack of clear trend strength, while the Moving Average Convergence Divergence (MACD) highlights strong downside momentum. The Relative Strength Index (RSI) remains in Sell territory, and the Stochastic RSI signals a Strong Sell, though the Commodity Channel Index (CCI) is neutral, indicating the absence of oversold conditions. Intraday, Bull/Bear Power points to buyer presence, and the Awesome Oscillator (AO) is neutral, creating a divergence between upward price action and mostly bearish momentum signals.
Downside risk prevails as volatility band defines near-term range
Over the next two to three trading days, XRP is projected to fluctuate between $1.0071 and $1.0762, reflecting a volatility band relative to current levels. The baseline scenario anticipates price holding within this range, consistent with mixed indicator signals and prevailing order flow. Should buyers regain initiative, a breakout above $1.0762 could occur, while a downside move below $1.0071 becomes likely if sellers overpower support. The probability of upward movement is low, with downward risk remaining elevated in the short term.
Earlier, analysts noted that persistent technical weakness and cautious sentiment were dominating XRP's near-term outlook. This article strengthens that view by highlighting that, despite ongoing institutional inflows, downside risk remains elevated, with traders advised to monitor a potential break below $1.0071 as a signal of renewed bearish momentum.


-
 Afghanistan
-
 Albania
-
 Algeria
-
 Angola
-
 Argentina
-
 Armenia
-
 Australia
-
 Austria
-
 Azerbaijan
-
 Bahamas
-
 Bahrain
-
 Bangladesh
-
 Belarus
-
 Belgium
-
 Bolivia
-
 Botswana
-
 Brazil
-
 Brunei
-
 Bulgaria
-
 Cambodia
-
 Cameroon
-
 Canada
-
 Chile
Chile
-
 China
China
-
 Colombia
-
 Congo
Congo
-
 Costa Rica
-
 Cote d'Ivoire
-
 Croatia
-
 Cuba
Cuba
-
 Cyprus
-
 Czechia
-
 DR Congo
-
 Denmark
-
 Dominican Republic
-
 Ecuador
-
 Egypt
Egypt
-
 El Salvador
-
 Estonia
-
 Eswatini
-
 Ethiopia
-
 Finland
-
 France
-
 Georgia
-
 Germany
-
 Ghana
Ghana
-
 Greece
-
 Haiti
Haiti
-
 Hong Kong
-
 Hungary
-
 India
India
-
 Indonesia
-
 Iran, Islamic republic
-
 Iraq
Iraq
-
 Ireland
-
 Israel
-
 Italy
Italy
-
 Jamaica
-
 Japan
Japan
-
 Jordan
-
 Kazakhstan
-
 Kenya
Kenya
-
 Korea
Korea
-
 Kuwait
-
 Kyrgyzstan
-
 Laos
Laos
-
 Latvia
-
 Lebanon
-
 Lesotho
-
 Libya
Libya
-
 Lithuania
-
 Luxembourg
-
 Madagascar
-
 Malaysia
-
 Malta
Malta
-
 Mauritius
-
 Mexico
-
 Moldova
-
 Mongolia
-
 Montenegro
-
 Morocco
-
 Mozambique
-
 Myanmar
-
 Namibia
-
 Nepal
Nepal
-
 Netherlands
-
 New Zealand
-
 Nigeria
-
 North Macedonia
-
 Norway
-
 Oman
Oman
-
 Pakistan
-
 Palestine
-
 Panama
-
 Papua New Guinea
-
 Paraguay
-
 Peru
Peru
-
 Philippines
-
 Poland
-
 Portugal
-
 Puerto Rico
-
 Qatar
Qatar
-
 Reunion
-
 Romania
-
 Rwanda
-
 Saudi Arabia
-
 Serbia
-
 Singapore
-
 Slovakia
-
 Slovenia
-
 Somalia
-
 South Africa
-
 Spain
Spain
-
 Sri Lanka
-
 Sweden
-
 Switzerland
-
 Syria
Syria
-
 Taiwan
-
 Tajikistan
-
 Tanzania
-
 Thailand
-
 Trinidad and Tobago
-
 Tunisia
-
 Turkey
-
 UAE
UAE
-
 Uganda
-
 Ukraine
-
 United Kingdom
-
United States
-
 Uruguay
-
 Uzbekistan
-
 Venezuela
-
 Vietnam
-
 Yemen
Yemen
-
 Zambia
-
 Zimbabwe
- Forex
- Crypto
