
+7.78% for Ethena as price moves above recent resistance levels

Ethena (ENA) is trading at $0.0817, showing a daily gain of 7.78% and currently positioned above its key short- and medium-term moving averages.
 0.0864
0.0932
0.0864
0.0932
Highlights
- Ethena faces declining protocol adoption, with total value locked and trading volumes falling, directly weakening asset demand.
- Reduced interest in USDe stablecoin and lower derivatives funding rates have eroded incentives and intensified market pressure.
- Short- and medium-term momentum for ENA/USD is temporarily bullish with high intraday volatility, but longer-term sentiment remains bearish; the expected 1–3 day range is $0.0725 to $0.0854 with likely consolidation.
Demand and liquidity risks grow as protocol activity declines
A key driver affecting Ethena is the reduction in the protocol's total value locked alongside falling trading volumes, which translates into lower market and on-chain activity and can undermine asset demand. According to Diariobitcoin, weakening interest in Ethena's USDe stablecoin and reduced funding rates in derivatives markets have further curtailed incentives to participate in the ecosystem, adding to the prevailing market pressure. Diminished liquidity and engagement, paired with slowing protocol adoption, have set the backdrop for recent volatility.
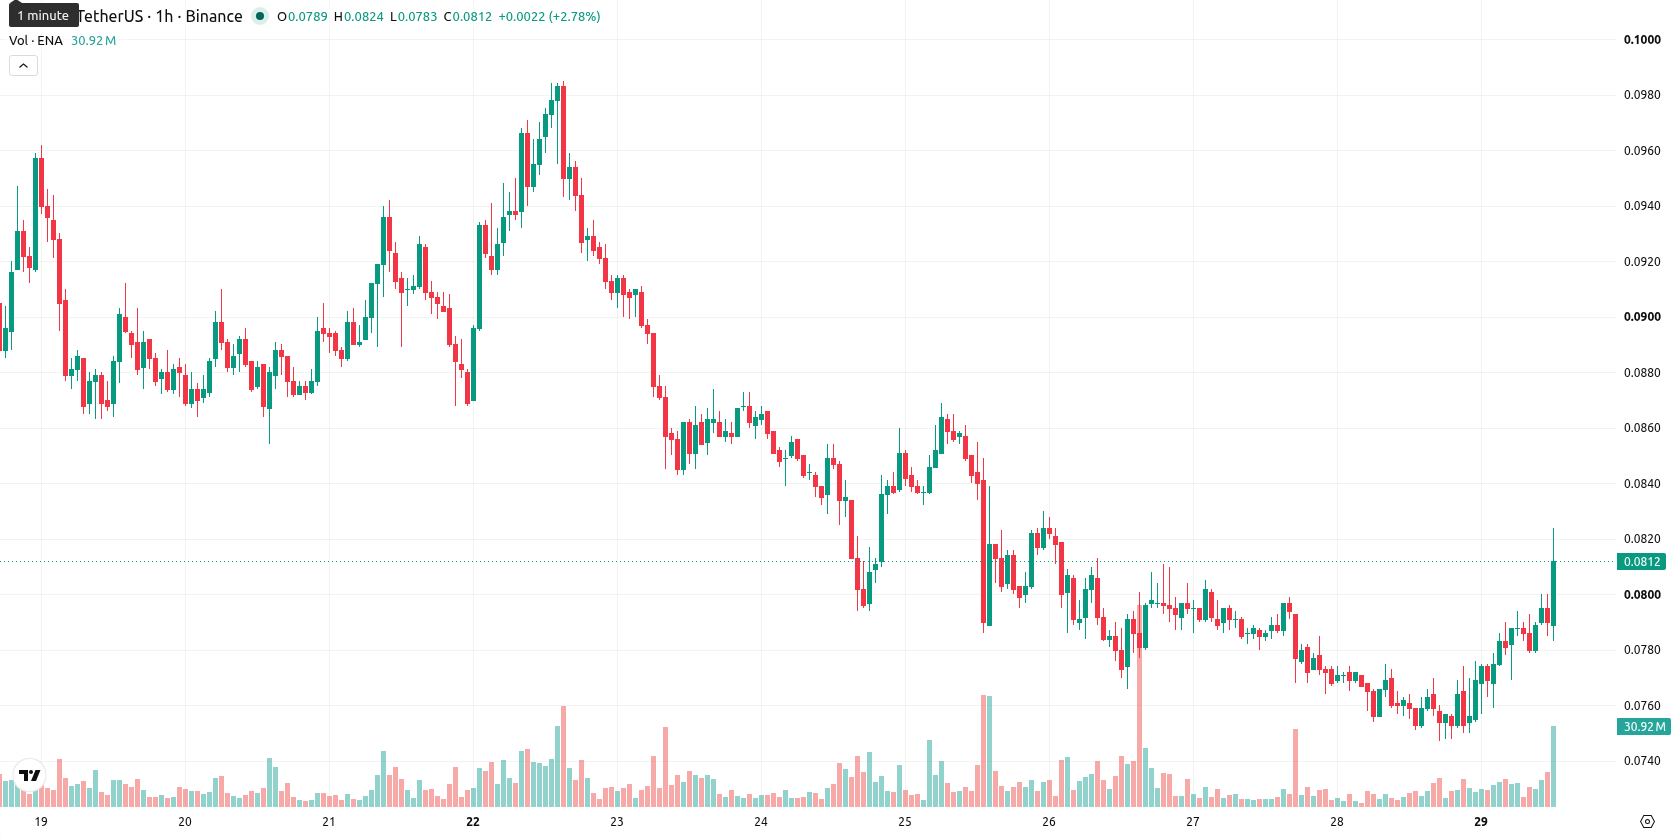
Mixed momentum signals amid resistance at daily MA-200
Looking at the technical setup, ENA is trading above both the MA-20 ($0.0773) and MA-50 ($0.0773) on the H1 chart but remains below the daily MA-200 ($0.1307). The Ichimoku Kijun level at $0.0774 is acting as an immediate support. On the momentum front, the Moving Average Convergence Divergence (MACD) indicates a buy, while the Average Directional Index (ADX) is neutral, suggesting limited trend strength. The Relative Strength Index (RSI) is in buy territory, but there are warning signs from the Stochastic RSI, which highlights strong selling pressure, and the Commodity Channel Index (CCI), which is overbought. Bull/Bear Power shows buyer dominance on the intraday frame, though the Awesome Oscillator is neutral, collectively illustrating mixed signals across indicators.
Consolidation likely as breakout odds favor upside
Over the next 1 to 3 trading days, ENA is expected to consolidate within the $0.0725 to $0.0854 range, reflecting the current volatility band relative to existing levels. There is a 67% probability of an upward breakout, while a move lower is less likely at 33%. The baseline scenario remains near-term consolidation unless a clear break above resistance or a drop below immediate support occurs, which would shape the next directional bias.
Earlier, analysts noted that Ethena faced persistent selling pressure and subdued technical momentum amid shifts in ecosystem token allocations and institutional activity. The current turn toward upward price action, despite underlying declines in liquidity and engagement, introduces fresh volatility, making monitoring for a clear break outside the $0.0725 to $0.0854 consolidation band essential for traders navigating the near-term outlook.








-
 Afghanistan
-
 Albania
-
 Algeria
-
 Angola
-
 Argentina
-
 Armenia
-
 Australia
-
 Austria
-
 Azerbaijan
-
 Bahamas
-
 Bahrain
-
 Bangladesh
-
 Belarus
-
 Belgium
-
 Bolivia
-
 Botswana
-
 Brazil
-
 Brunei
-
 Bulgaria
-
 Cambodia
-
 Cameroon
-
 Canada
-
 Chile
Chile
-
 China
China
-
 Colombia
-
 Congo
Congo
-
 Costa Rica
-
 Cote d'Ivoire
-
 Croatia
-
 Cuba
Cuba
-
 Cyprus
-
 Czechia
-
 DR Congo
-
 Denmark
-
 Dominican Republic
-
 Ecuador
-
 Egypt
Egypt
-
 El Salvador
-
 Estonia
-
 Eswatini
-
 Ethiopia
-
 Finland
-
 France
-
 Georgia
-
 Germany
-
 Ghana
Ghana
-
 Greece
-
 Haiti
Haiti
-
 Hong Kong
-
 Hungary
-
 India
India
-
 Indonesia
-
 Iran, Islamic republic
-
 Iraq
Iraq
-
 Ireland
-
 Israel
-
 Italy
Italy
-
 Jamaica
-
 Japan
Japan
-
 Jordan
-
 Kazakhstan
-
 Kenya
Kenya
-
 Korea
Korea
-
 Kuwait
-
 Kyrgyzstan
-
 Laos
Laos
-
 Latvia
-
 Lebanon
-
 Lesotho
-
 Libya
Libya
-
 Lithuania
-
 Luxembourg
-
 Madagascar
-
 Malaysia
-
 Malta
Malta
-
 Mauritius
-
 Mexico
-
 Moldova
-
 Mongolia
-
 Montenegro
-
 Morocco
-
 Mozambique
-
 Myanmar
-
 Namibia
-
 Nepal
Nepal
-
 Netherlands
-
 New Zealand
-
 Nigeria
-
 North Macedonia
-
 Norway
-
 Oman
Oman
-
 Pakistan
-
 Palestine
-
 Panama
-
 Papua New Guinea
-
 Paraguay
-
 Peru
Peru
-
 Philippines
-
 Poland
-
 Portugal
-
 Puerto Rico
-
 Qatar
Qatar
-
 Reunion
-
 Romania
-
 Rwanda
-
 Saudi Arabia
-
 Serbia
-
 Singapore
-
 Slovakia
-
 Slovenia
-
 Somalia
-
 South Africa
-
 Spain
Spain
-
 Sri Lanka
-
 Sweden
-
 Switzerland
-
 Syria
Syria
-
 Taiwan
-
 Tajikistan
-
 Tanzania
-
 Thailand
-
 Trinidad and Tobago
-
 Tunisia
-
 Turkey
-
 UAE
UAE
-
 Uganda
-
 Ukraine
-
 United Kingdom
-
United States
-
 Uruguay
-
 Uzbekistan
-
 Venezuela
-
 Vietnam
-
 Yemen
Yemen
-
 Zambia
-
 Zimbabwe
- Forex
- Crypto












