
LTC holds above $43.00 as resistance at MA-20 limits bullish attempts: weekly report

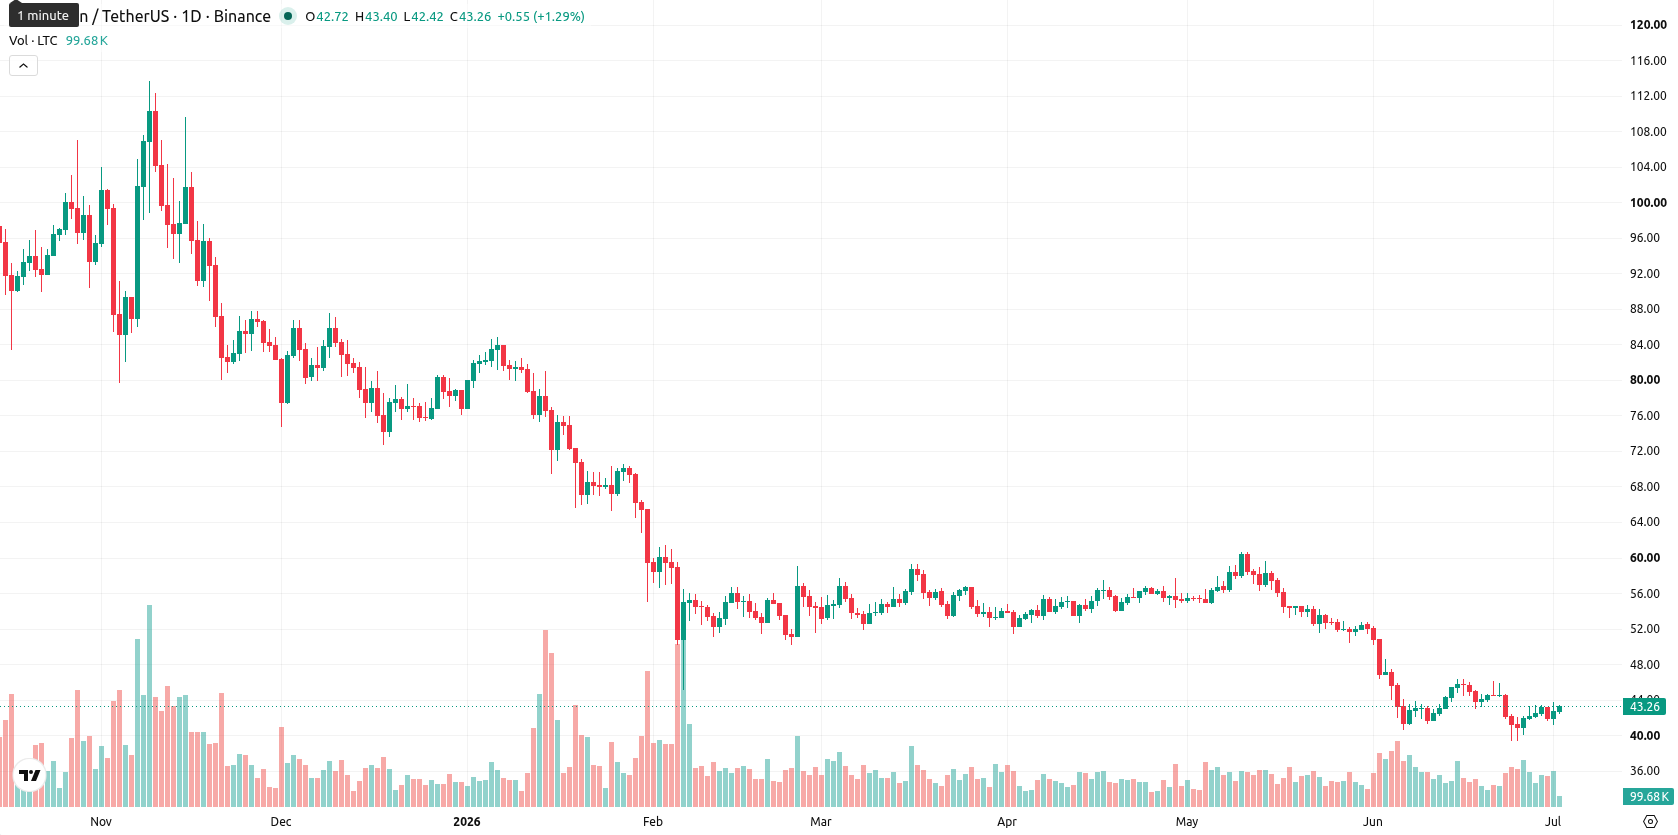
Litecoin (LTC) is currently priced at $43.30 after gaining $1.42 (3.25%) over the past week, closing near the top of its weekly range amid 9.17% volatility. The asset remains well below its weekly MA-20 ($52.29), MA-50 ($78.43), and MA-200 ($80.54), indicating continued downward pressure across all major weekly moving averages.
 46.48
48.28
46.48
48.28
Highlights
- Litecoin remains under sustained selling pressure, trading well below key moving averages and indicating a persistent bearish trend.
- Technical momentum and trend indicators overwhelmingly signal downside risk, though oscillators suggest selling exhaustion with no confirmed reversal.
- Next week's forecast range is $39.00–$47.20, with low probability of upside and a sideways to lower bias dominant.
Bearish momentum persists this week as technicals reinforce downward bias
Weekly technical indicators confirm persistent bearish momentum for LTC. The price remains well below key weekly moving averages, with the Ichimoku Kijun also sitting above the current level, signaling resistance at MA-20. The W1 MACD and ADX both highlight strong selling activity, while oscillators such as RSI and Stochastic RSI are deep in oversold territory, revealing selling exhaustion with no confirmed reversal. Additional indicators, including CCI, Bull/Bear Power, and the Awesome Oscillator, all reinforce the bearish trend.
Sideways or lower moves expected next week amid persistent bearish signals
For the next 7 days, Litecoin is forecast to trade between $39.00 and $47.20, reflecting the amplitude of recent weekly volatility. With all key indicators still signaling bearish conditions and no buy signals present, there is a much higher probability of sideways or lower movement. A bullish breakout would require sustained buying above $47.20, while a renewed wave of selling could push LTC down to $39.00 or lower. The baseline scenario anticipates rangebound trading within the established support and resistance levels.
Earlier, analysts noted that Litecoin continued to face significant bearish momentum amid persistent weakness across key technical indicators. The latest weekly action reinforces this trend, highlighting that sustained downside risks remain in focus, with traders advised to monitor for any decisive move beyond the $47.20 resistance or below the $39.00 support for a potential shift in momentum.









-
 Afghanistan
-
 Albania
-
 Algeria
-
 Angola
-
 Argentina
-
 Armenia
-
 Australia
-
 Austria
-
 Azerbaijan
-
 Bahamas
-
 Bahrain
-
 Bangladesh
-
 Belarus
-
 Belgium
-
 Bolivia
-
 Botswana
-
 Brazil
-
 Brunei
-
 Bulgaria
-
 Cambodia
-
 Cameroon
-
 Canada
-
 Chile
Chile
-
 China
China
-
 Colombia
-
 Congo
Congo
-
 Costa Rica
-
 Cote d'Ivoire
-
 Croatia
-
 Cuba
Cuba
-
 Cyprus
-
 Czechia
-
 DR Congo
-
 Denmark
-
 Dominican Republic
-
 Ecuador
-
 Egypt
Egypt
-
 El Salvador
-
 Estonia
-
 Eswatini
-
 Ethiopia
-
 Finland
-
 France
-
 Georgia
-
 Germany
-
 Ghana
Ghana
-
 Greece
-
 Haiti
Haiti
-
 Hong Kong
-
 Hungary
-
 India
India
-
 Indonesia
-
 Iran, Islamic republic
-
 Iraq
Iraq
-
 Ireland
-
 Israel
-
 Italy
Italy
-
 Jamaica
-
 Japan
Japan
-
 Jordan
-
 Kazakhstan
-
 Kenya
Kenya
-
 Korea
Korea
-
 Kuwait
-
 Kyrgyzstan
-
 Laos
Laos
-
 Latvia
-
 Lebanon
-
 Lesotho
-
 Libya
Libya
-
 Lithuania
-
 Luxembourg
-
 Madagascar
-
 Malaysia
-
 Malta
Malta
-
 Mauritius
-
 Mexico
-
 Moldova
-
 Mongolia
-
 Montenegro
-
 Morocco
-
 Mozambique
-
 Myanmar
-
 Namibia
-
 Nepal
Nepal
-
 Netherlands
-
 New Zealand
-
 Nigeria
-
 North Macedonia
-
 Norway
-
 Oman
Oman
-
 Pakistan
-
 Palestine
-
 Panama
-
 Papua New Guinea
-
 Paraguay
-
 Peru
Peru
-
 Philippines
-
 Poland
-
 Portugal
-
 Puerto Rico
-
 Qatar
Qatar
-
 Reunion
-
 Romania
-
 Rwanda
-
 Saudi Arabia
-
 Serbia
-
 Singapore
-
 Slovakia
-
 Slovenia
-
 Somalia
-
 South Africa
-
 Spain
Spain
-
 Sri Lanka
-
 Sweden
-
 Switzerland
-
 Syria
Syria
-
 Taiwan
-
 Tajikistan
-
 Tanzania
-
 Thailand
-
 Trinidad and Tobago
-
 Tunisia
-
 Turkey
-
 UAE
UAE
-
 Uganda
-
 Ukraine
-
 United Kingdom
-
United States
-
 Uruguay
-
 Uzbekistan
-
 Venezuela
-
 Vietnam
-
 Yemen
Yemen
-
 Zambia
-
 Zimbabwe
- Forex
- Crypto












