
Nexo edges higher amid persistent seller pressure below key moving averages: weekly outlook

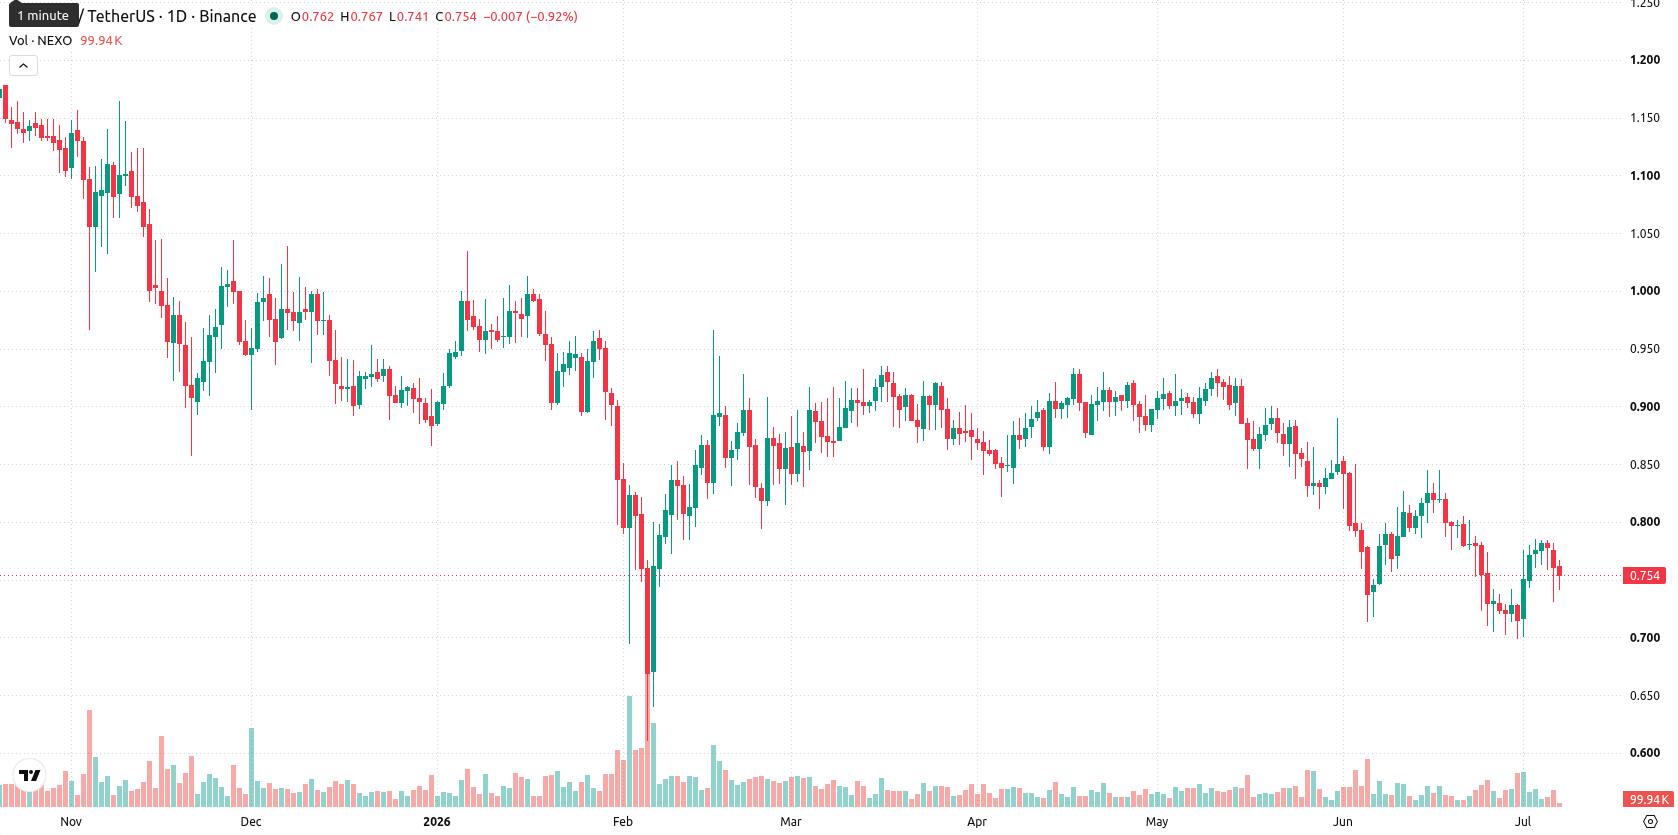
Nexo (NEXO) is currently trading at $0.754, up $0.040 or 5.32% for the week. The asset remains below its weekly MA-20 at $0.8468, MA-50 at $0.9847, and MA-200 at $0.9761, indicating sustained seller pressure and positioning NEXO beneath all major weekly moving averages.
 0.748
0.7850
0.748
0.7850
Highlights
- NEXO price remains under pressure, trading below key moving averages and indicating persistent seller dominance in both medium- and long-term outlooks.
- Momentum indicators, including MACD, ADX, and RSI, confirm a sustained bearish bias, while oversold readings suggest no imminent reversal.
- NEXO is projected to move within a $0.722 to $0.796 range over the next week, with low probability of a breakout and a baseline expectation for sideways trading.
Seller control persists as bearish momentum limits reversal outlook
Technical analysis on the weekly (W1) timeframe shows persistent negative momentum for NEXO. Momentum indicators such as the MACD and ADX remain bearish, while the RSI is also in bearish territory. The Commodity Channel Index is oversold, suggesting some exhaustion among sellers, and the Stochastic RSI is neutral, reflecting a loss of upward drive but no clear shift in momentum. Both Bull/Bear Power and the Awesome Oscillator show no clear bullish signal, underlining ongoing seller dominance and limited conviction for a reversal.
Sideways trading expected as bullish signals remain absent this week
For the next 7 days, weekly indicators suggest a likely scenario of sideways movement for NEXO, with an expected range between $0.722 and $0.796. Given that none of the four key momentum indicators are in Buy or Strong Buy, the probability of further upside is low, estimated at under 20%. A sustained move above $0.796 would be needed to trigger a bullish scenario, while a breakdown below $0.722 could open the door to additional downside. The baseline forecast is for stable prices with low directional bias.
Previously it was reported that Nexo reaffirmed its ongoing partnership with the Audi F1 team but provided no additional details about the collaboration's scope. In the context of the current technical outlook, traders should monitor any sustained break above $0.796 for early signs of a bullish reversal, as the prevailing trend remains sideways with limited upward momentum.





Latest Nexo News








-
 Afghanistan
-
 Albania
-
 Algeria
-
 Angola
-
 Argentina
-
 Armenia
-
 Australia
-
 Austria
-
 Azerbaijan
-
 Bahamas
-
 Bahrain
-
 Bangladesh
-
 Belarus
-
 Belgium
-
 Bolivia
-
 Botswana
-
 Brazil
-
 Brunei
-
 Bulgaria
-
 Cambodia
-
 Cameroon
-
 Canada
-
 Chile
Chile
-
 China
China
-
 Colombia
-
 Congo
Congo
-
 Costa Rica
-
 Cote d'Ivoire
-
 Croatia
-
 Cuba
Cuba
-
 Cyprus
-
 Czechia
-
 DR Congo
-
 Denmark
-
 Dominican Republic
-
 Ecuador
-
 Egypt
Egypt
-
 El Salvador
-
 Estonia
-
 Eswatini
-
 Ethiopia
-
 Finland
-
 France
-
 Georgia
-
 Germany
-
 Ghana
Ghana
-
 Greece
-
 Haiti
Haiti
-
 Hong Kong
-
 Hungary
-
 India
India
-
 Indonesia
-
 Iran, Islamic republic
-
 Iraq
Iraq
-
 Ireland
-
 Israel
-
 Italy
Italy
-
 Jamaica
-
 Japan
Japan
-
 Jordan
-
 Kazakhstan
-
 Kenya
Kenya
-
 Korea
Korea
-
 Kuwait
-
 Kyrgyzstan
-
 Laos
Laos
-
 Latvia
-
 Lebanon
-
 Lesotho
-
 Libya
Libya
-
 Lithuania
-
 Luxembourg
-
 Madagascar
-
 Malaysia
-
 Malta
Malta
-
 Mauritius
-
 Mexico
-
 Moldova
-
 Mongolia
-
 Montenegro
-
 Morocco
-
 Mozambique
-
 Myanmar
-
 Namibia
-
 Nepal
Nepal
-
 Netherlands
-
 New Zealand
-
 Nigeria
-
 North Macedonia
-
 Norway
-
 Oman
Oman
-
 Pakistan
-
 Palestine
-
 Panama
-
 Papua New Guinea
-
 Paraguay
-
 Peru
Peru
-
 Philippines
-
 Poland
-
 Portugal
-
 Puerto Rico
-
 Qatar
Qatar
-
 Reunion
-
 Romania
-
 Rwanda
-
 Saudi Arabia
-
 Serbia
-
 Singapore
-
 Slovakia
-
 Slovenia
-
 Somalia
-
 South Africa
-
 Spain
Spain
-
 Sri Lanka
-
 Sweden
-
 Switzerland
-
 Syria
Syria
-
 Taiwan
-
 Tajikistan
-
 Tanzania
-
 Thailand
-
 Trinidad and Tobago
-
 Tunisia
-
 Turkey
-
 UAE
UAE
-
 Uganda
-
 Ukraine
-
 United Kingdom
-
United States
-
 Uruguay
-
 Uzbekistan
-
 Venezuela
-
 Vietnam
-
 Yemen
Yemen
-
 Zambia
-
 Zimbabwe
- Forex
- Crypto











