
Bitcoin stays under pressure as spot Bitcoin ETF net inflows hit $266 million

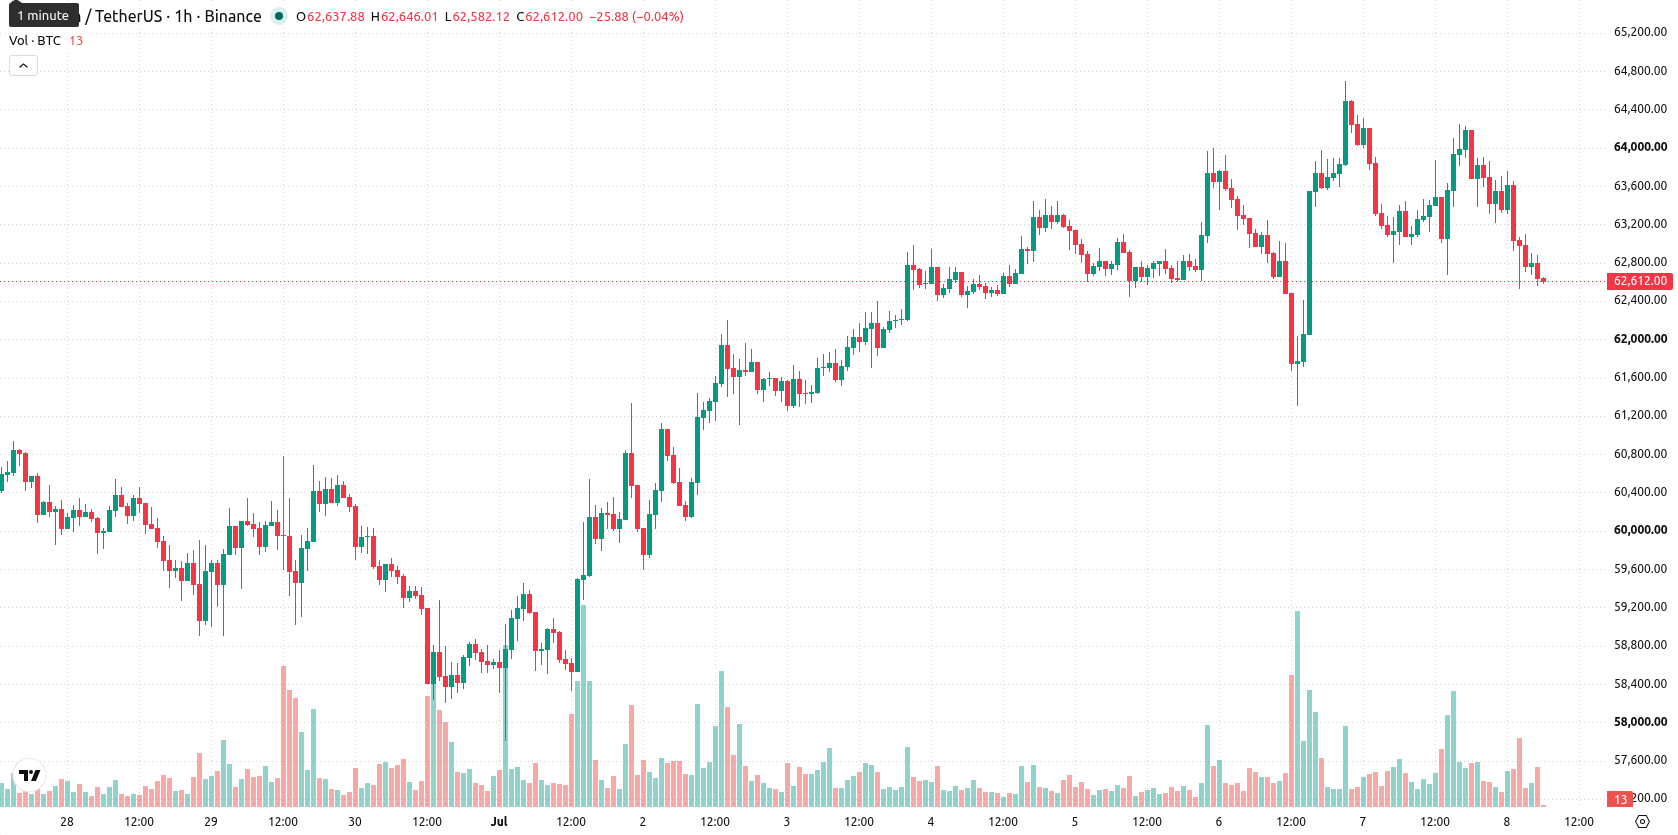
Bitcoin (BTC) is trading at $62,646, posting a modest decline today and remaining below its key short- and long-term moving averages. The move occurs amid moderate volatility, with the asset holding near the session's low.
 63761.99
64700.00
63761.99
64700.00
Highlights
- Strategy liquidated 3,588 Bitcoin for $216 million, raising cash reserves to $2.55 billion and creating short-term selling pressure.
- Spot Bitcoin ETFs drew $266 million net inflows, led by BlackRock’s $209 million, reflecting continued institutional demand despite market supply uptick.
- BTC/USD faces sustained bearish momentum, with price expected to consolidate between $61,502 and $64,518 over the next few days.
Selling pressure rises as corporate divestments meet ETF inflows
Strategy (formerly MicroStrategy) sold 3,588 Bitcoin between June 29 and July 5, 2026, raising approximately $216 million to address dividend obligations and increasing its USD reserve base to $2.55 billion, according to Cryptotimes. This action increased immediate supply in the market, introducing potential short-term selling pressure and demonstrating corporate treasury management adjustments. Meanwhile, U.S. spot Bitcoin ETFs recorded $266 million in net inflows on July 6, 2026, led by BlackRock's IBIT with $209 million, signaling continued institutional demand per Cryptoslate. As context, the U.S. government's Bitcoin holdings remain unchanged at 328,372 BTC amid delays in expanding its Strategic Bitcoin Reserve due to agency disagreements, as reported by Bitcoinfoundation.
Oversold readings persist as downside momentum faces resistance
On the technical front, BTC/USD trades below the 20-period and 50-period moving averages on the 1-hour chart, and remains well below the long-term 200-period moving average. Immediate resistance is marked by the Ichimoku Kijun at $63,384. The Moving Average Convergence Divergence (MACD) signals a Sell, while the Average Directional Index (ADX) is Neutral. Oscillators including the Relative Strength Index (RSI), Commodity Channel Index (CCI), Stochastic RSI, and Bull/Bear Power all indicate oversold conditions with seller dominance, a view further supported by the Awesome Oscillator. This combination reflects a backdrop of persistent downside momentum tempered by signs of potential exhaustion.
Further downside risk as consolidation likely within support range
Over the next 2–3 trading days, typical volatility suggests BTC is likely to consolidate in a range between $61,502 and $64,518. Scenario probabilities lean toward further downside, with only a 29% chance of an upward breakout. The baseline view is for sideways movement within this band; a breakout above $63,384 would require renewed bullish momentum, while a loss of support at $61,502 may drive a deeper correction.
Earlier, analysts noted that the record-long negative trend in the Coinbase Bitcoin Premium Index reflected sustained institutional selling pressure in the United States. The recent combination of renewed inflows into U.S. spot Bitcoin ETFs and visible corporate treasury sales introduces a more nuanced environment, making the $61,502 support level a key focus for any shift in market sentiment over the coming sessions.















-
 Afghanistan
-
 Albania
-
 Algeria
-
 Angola
-
 Argentina
-
 Armenia
-
 Australia
-
 Austria
-
 Azerbaijan
-
 Bahamas
-
 Bahrain
-
 Bangladesh
-
 Belarus
-
 Belgium
-
 Bolivia
-
 Botswana
-
 Brazil
-
 Brunei
-
 Bulgaria
-
 Cambodia
-
 Cameroon
-
 Canada
-
 Chile
Chile
-
 China
China
-
 Colombia
-
 Congo
Congo
-
 Costa Rica
-
 Cote d'Ivoire
-
 Croatia
-
 Cuba
Cuba
-
 Cyprus
-
 Czechia
-
 DR Congo
-
 Denmark
-
 Dominican Republic
-
 Ecuador
-
 Egypt
Egypt
-
 El Salvador
-
 Estonia
-
 Eswatini
-
 Ethiopia
-
 Finland
-
 France
-
 Georgia
-
 Germany
-
 Ghana
Ghana
-
 Greece
-
 Haiti
Haiti
-
 Hong Kong
-
 Hungary
-
 India
India
-
 Indonesia
-
 Iran, Islamic republic
-
 Iraq
Iraq
-
 Ireland
-
 Israel
-
 Italy
Italy
-
 Jamaica
-
 Japan
Japan
-
 Jordan
-
 Kazakhstan
-
 Kenya
Kenya
-
 Korea
Korea
-
 Kuwait
-
 Kyrgyzstan
-
 Laos
Laos
-
 Latvia
-
 Lebanon
-
 Lesotho
-
 Libya
Libya
-
 Lithuania
-
 Luxembourg
-
 Madagascar
-
 Malaysia
-
 Malta
Malta
-
 Mauritius
-
 Mexico
-
 Moldova
-
 Mongolia
-
 Montenegro
-
 Morocco
-
 Mozambique
-
 Myanmar
-
 Namibia
-
 Nepal
Nepal
-
 Netherlands
-
 New Zealand
-
 Nigeria
-
 North Macedonia
-
 Norway
-
 Oman
Oman
-
 Pakistan
-
 Palestine
-
 Panama
-
 Papua New Guinea
-
 Paraguay
-
 Peru
Peru
-
 Philippines
-
 Poland
-
 Portugal
-
 Puerto Rico
-
 Qatar
Qatar
-
 Reunion
-
 Romania
-
 Rwanda
-
 Saudi Arabia
-
 Serbia
-
 Singapore
-
 Slovakia
-
 Slovenia
-
 Somalia
-
 South Africa
-
 Spain
Spain
-
 Sri Lanka
-
 Sweden
-
 Switzerland
-
 Syria
Syria
-
 Taiwan
-
 Tajikistan
-
 Tanzania
-
 Thailand
-
 Trinidad and Tobago
-
 Tunisia
-
 Turkey
-
 UAE
UAE
-
 Uganda
-
 Ukraine
-
 United Kingdom
-
United States
-
 Uruguay
-
 Uzbekistan
-
 Venezuela
-
 Vietnam
-
 Yemen
Yemen
-
 Zambia
-
 Zimbabwe
- Forex
- Crypto











