

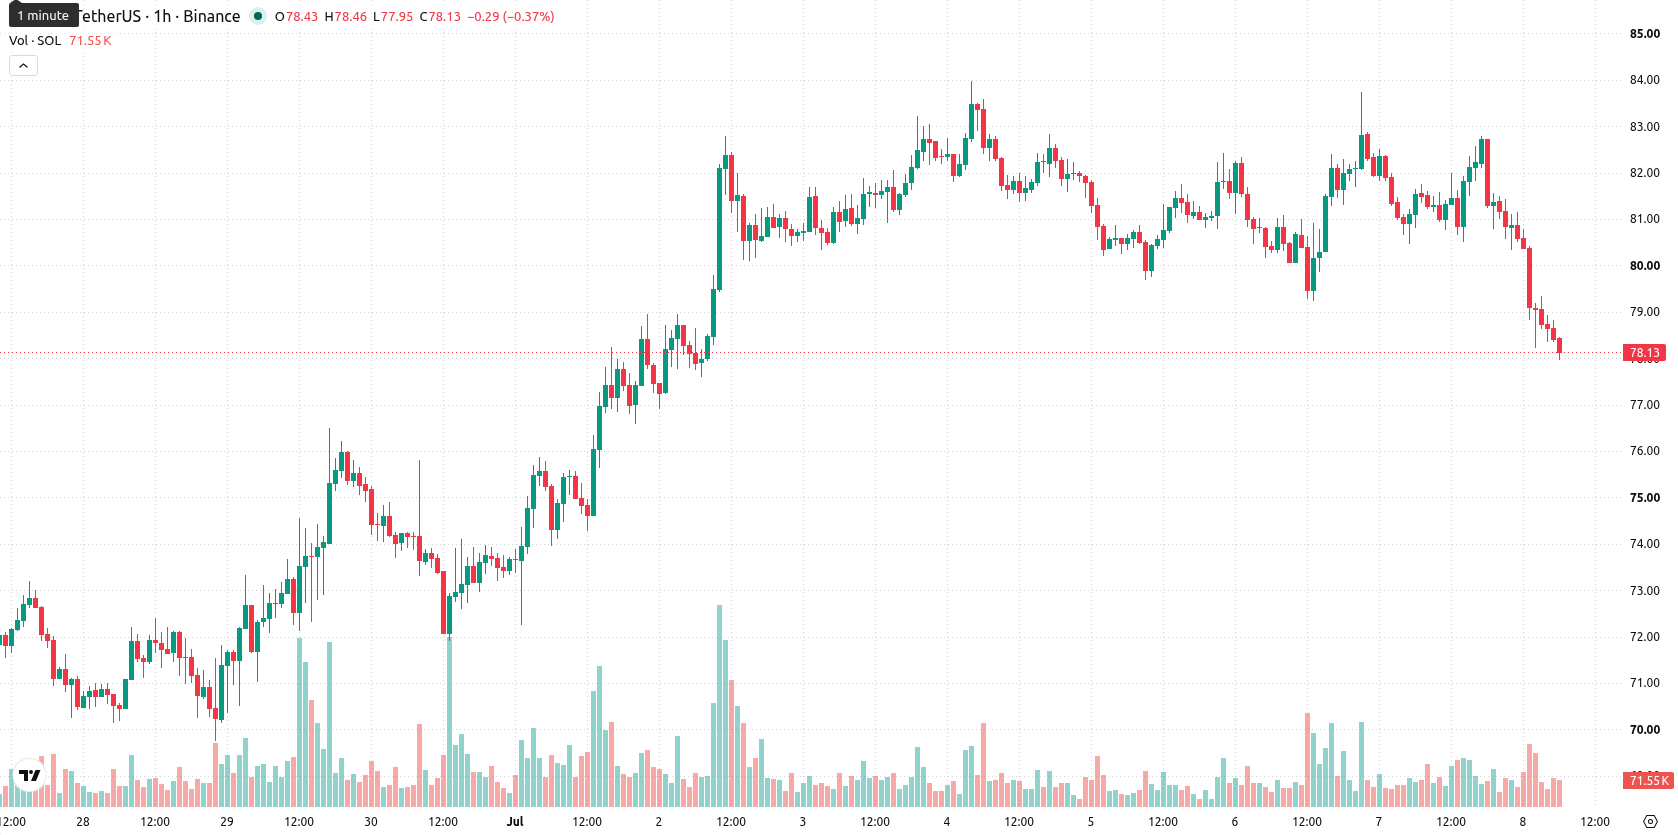
Solana (SOL) is trading at $78.25 after a 3.44% decline today, with price action firmly below its key moving averages on elevated intraday volatility.
 80.78
83.98
80.78
83.98
Highlights
- SurancePlus completed $7.1 million in tokenized reinsurance placements on Solana, demonstrating increased institutional adoption of the blockchain for real-world DeFi applications.
- Strong institutional engagement is evident as Goldman Sachs disclosed $108 million in SOL ETF holdings and BlackRock’s BUIDL fund cleared $550 million in Solana-based transactions.
- SOL/USD faces persistent bearish pressure with all key momentum indicators signaling strong sell, projecting a likely trading range of $76.67–$83.28 in the next 2–3 days.
Institutional adoption rises as broader selling pressure persists
SurancePlus completed five private placements of tokenized reinsurance securities using the Solana blockchain on July 7, 2026, raising $7.1 million and highlighting the platform’s growing integration in institutional financial products, according to Manilatimes. This visibility in real-world DeFi use cases supports Solana’s profile as an enterprise-grade blockchain, further evidenced by the activation of on-chain governance to empower large validators with proposal rights and increased network decentralization. Additional context is provided by $108 million in SOL ETF holdings disclosed by Goldman Sachs and $550 million in transactions cleared by BlackRock’s BUIDL fund on the network, as reported by Financefeeds, alongside rising DeFi total value locked and sustained ETF inflows. These positive adoption markers have so far been accompanied by ongoing broader selling pressure.
Seller dominance intensifies as technical barriers cap rebound
Technically, SOL/USD is trading below the 20-day ($80.7), 50-day ($81.01), and 200-day ($92.98) moving averages, with the Ichimoku Kijun level at $80.51 acting as immediate resistance. On the downside, the key support is seen near $76.67, while resistance aligns with the $83.28 level. Momentum indicators such as the Moving Average Convergence Divergence (MACD) signal a Sell, and the Average Directional Index (ADX) is Neutral, reflecting trend uncertainty. The Relative Strength Index (RSI) stands at 27.39, and both the Stochastic RSI, Commodity Channel Index (CCI), and Bull/Bear Power are registering in oversold or Sell territory, signalling strong intraday seller dominance. The Awesome Oscillator further confirms the prevailing negative momentum.
Downside risks remain high as support tests become likely
Over the next 2–3 trading days, SOL/USD is expected to consolidate within the $76.67 to $83.28 volatility band, with a high probability of continued downside pressure and limited prospects for a sustained bounce. A bullish reversal would require a decisive breakout above resistance at the $80.51 Ichimoku Kijun level. If support at $76.67 fails, a further bearish scenario could unfold, increasing the likelihood of lower price discovery in the short term.
Earlier, analysts noted that Solana faced mixed technical signals and was likely to trade sideways as market participants evaluated robust on-chain fundamentals alongside persistent selling pressure. The latest developments, including increased institutional adoption and real-world DeFi integration, reinforce Solana’s long-term potential, but with strong downside momentum prevailing, failure to hold the $76.67 support could accelerate short-term losses.













-
 Afghanistan
-
 Albania
-
 Algeria
-
 Angola
-
 Argentina
-
 Armenia
-
 Australia
-
 Austria
-
 Azerbaijan
-
 Bahamas
-
 Bahrain
-
 Bangladesh
-
 Belarus
-
 Belgium
-
 Bolivia
-
 Botswana
-
 Brazil
-
 Brunei
-
 Bulgaria
-
 Cambodia
-
 Cameroon
-
 Canada
-
 Chile
Chile
-
 China
China
-
 Colombia
-
 Congo
Congo
-
 Costa Rica
-
 Cote d'Ivoire
-
 Croatia
-
 Cuba
Cuba
-
 Cyprus
-
 Czechia
-
 DR Congo
-
 Denmark
-
 Dominican Republic
-
 Ecuador
-
 Egypt
Egypt
-
 El Salvador
-
 Estonia
-
 Eswatini
-
 Ethiopia
-
 Finland
-
 France
-
 Georgia
-
 Germany
-
 Ghana
Ghana
-
 Greece
-
 Haiti
Haiti
-
 Hong Kong
-
 Hungary
-
 India
India
-
 Indonesia
-
 Iran, Islamic republic
-
 Iraq
Iraq
-
 Ireland
-
 Israel
-
 Italy
Italy
-
 Jamaica
-
 Japan
Japan
-
 Jordan
-
 Kazakhstan
-
 Kenya
Kenya
-
 Korea
Korea
-
 Kuwait
-
 Kyrgyzstan
-
 Laos
Laos
-
 Latvia
-
 Lebanon
-
 Lesotho
-
 Libya
Libya
-
 Lithuania
-
 Luxembourg
-
 Madagascar
-
 Malaysia
-
 Malta
Malta
-
 Mauritius
-
 Mexico
-
 Moldova
-
 Mongolia
-
 Montenegro
-
 Morocco
-
 Mozambique
-
 Myanmar
-
 Namibia
-
 Nepal
Nepal
-
 Netherlands
-
 New Zealand
-
 Nigeria
-
 North Macedonia
-
 Norway
-
 Oman
Oman
-
 Pakistan
-
 Palestine
-
 Panama
-
 Papua New Guinea
-
 Paraguay
-
 Peru
Peru
-
 Philippines
-
 Poland
-
 Portugal
-
 Puerto Rico
-
 Qatar
Qatar
-
 Reunion
-
 Romania
-
 Rwanda
-
 Saudi Arabia
-
 Serbia
-
 Singapore
-
 Slovakia
-
 Slovenia
-
 Somalia
-
 South Africa
-
 Spain
Spain
-
 Sri Lanka
-
 Sweden
-
 Switzerland
-
 Syria
Syria
-
 Taiwan
-
 Tajikistan
-
 Tanzania
-
 Thailand
-
 Trinidad and Tobago
-
 Tunisia
-
 Turkey
-
 UAE
UAE
-
 Uganda
-
 Ukraine
-
 United Kingdom
-
United States
-
 Uruguay
-
 Uzbekistan
-
 Venezuela
-
 Vietnam
-
 Yemen
Yemen
-
 Zambia
-
 Zimbabwe
- Forex
- Crypto











