

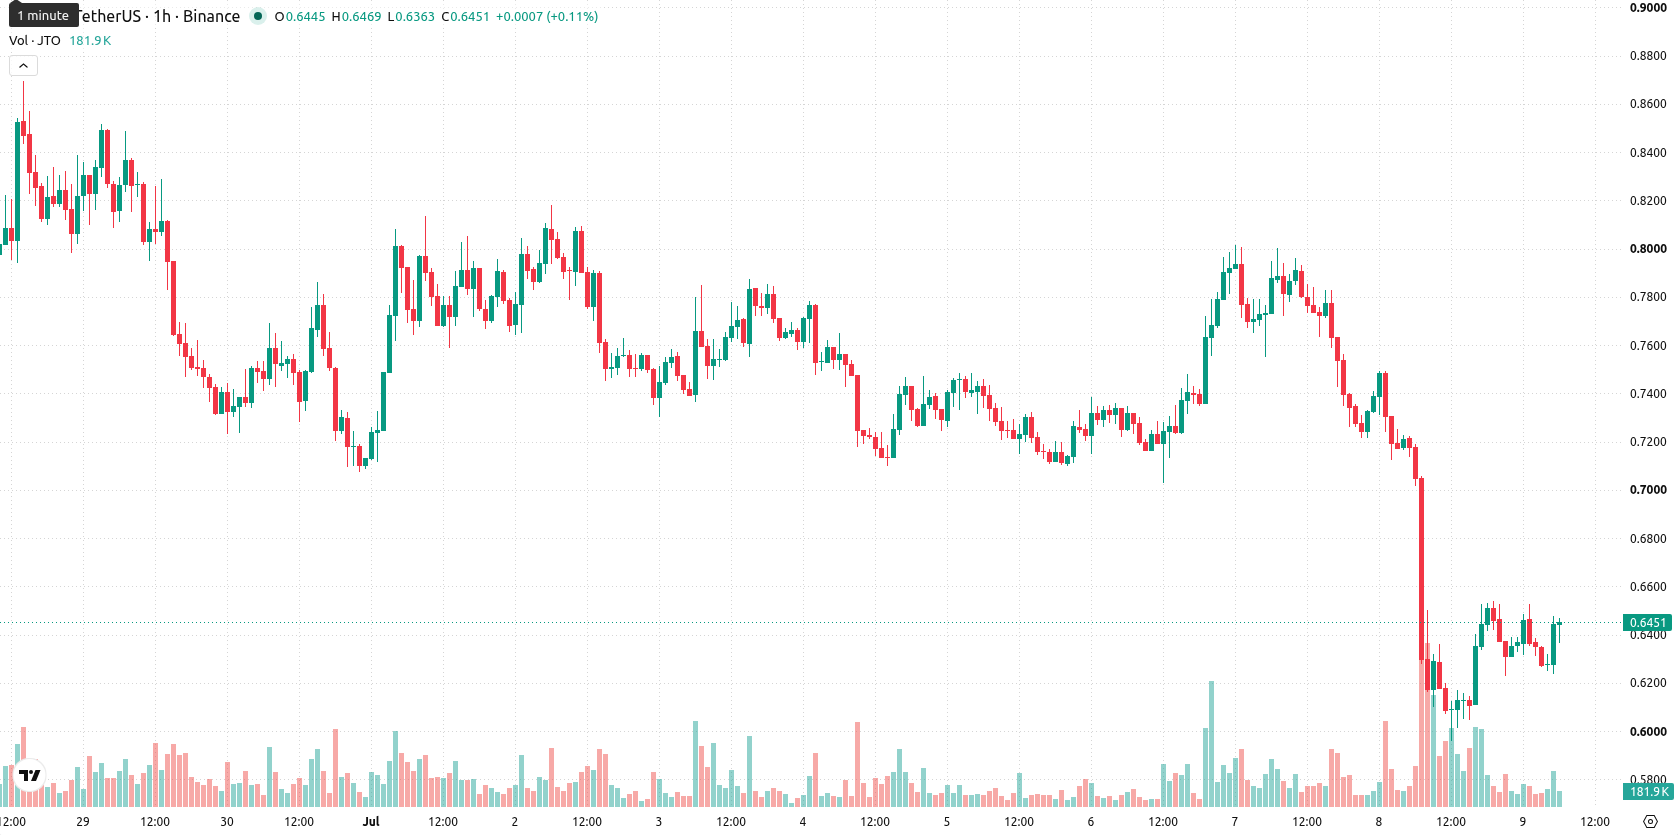
Jito (JTO) is trading at $0.6458, down 9.72% on the day. The price is currently above its key short-term moving average but sits below the intermediate-term average, while maintaining position above its long-term average.
 0.6679
0.8015
0.6679
0.8015
Highlights
- JTO/USD maintains a bullish long-term structure, trading above the 200-period moving average despite recent volatility.
- Short-term and intraday indicators are mixed, with weak momentum signals offset by some buyer interest and high two-way volatility.
- Expected price action favors a sideways range between $0.5969 and $0.6918 over the next 2–3 days, with modest bearish bias.
Mixed momentum as intraday buyers surface amid technical resistance
On the hourly chart, JTO is trading above the MA-20 and the long-term MA-200, but still below the MA-50, highlighting near-term support with ongoing medium-term resistance. The Ichimoku Kijun level at $0.6589 presents immediate resistance for the current session. Momentum remains weak, as both the Moving Average Convergence Divergence (MACD) and Average Directional Index (ADX) are on sell signals. The Relative Strength Index (RSI) is at 46.95, placing it in sell territory, while Stochastic RSI indicates overbought conditions. Divergent signals are evident among oscillators, with Commodity Channel Index (CCI) and Bull/Bear Power (BBP) both showing renewed buyer interest intraday amidst high volatility.
Bearish bias emerges as volatility bands define trading outlook
Over the next 2 to 3 trading days, JTO is expected to trade within the $0.5969 to $0.6918 volatility band relative to current levels. Scenario probabilities favor a modestly higher chance of decline (55%) versus an upward move (45%), with baseline expectations set for continued sideways movement. A potential bullish breakout would require a decisive push above the Ichimoku Kijun resistance at $0.6589, while violation of the $0.5969 support would open the door to a bearish scenario.
Earlier, analysts noted that Jito was experiencing pronounced short-term weakness amid ongoing high volatility, despite a generally constructive long-term outlook. With oscillators now showing renewed intraday buying interest but momentum remaining weak, traders should monitor for a sustained move above the Ichimoku Kijun resistance at $0.6589 as the next signal for directional bias.



Latest Jito News






-
 Afghanistan
-
 Albania
-
 Algeria
-
 Angola
-
 Argentina
-
 Armenia
-
 Australia
-
 Austria
-
 Azerbaijan
-
 Bahamas
-
 Bahrain
-
 Bangladesh
-
 Belarus
-
 Belgium
-
 Bolivia
-
 Botswana
-
 Brazil
-
 Brunei
-
 Bulgaria
-
 Cambodia
-
 Cameroon
-
 Canada
-
 Chile
Chile
-
 China
China
-
 Colombia
-
 Congo
Congo
-
 Costa Rica
-
 Cote d'Ivoire
-
 Croatia
-
 Cuba
Cuba
-
 Cyprus
-
 Czechia
-
 DR Congo
-
 Denmark
-
 Dominican Republic
-
 Ecuador
-
 Egypt
Egypt
-
 El Salvador
-
 Estonia
-
 Eswatini
-
 Ethiopia
-
 Finland
-
 France
-
 Georgia
-
 Germany
-
 Ghana
Ghana
-
 Greece
-
 Haiti
Haiti
-
 Hong Kong
-
 Hungary
-
 India
India
-
 Indonesia
-
 Iran, Islamic republic
-
 Iraq
Iraq
-
 Ireland
-
 Israel
-
 Italy
Italy
-
 Jamaica
-
 Japan
Japan
-
 Jordan
-
 Kazakhstan
-
 Kenya
Kenya
-
 Korea
Korea
-
 Kuwait
-
 Kyrgyzstan
-
 Laos
Laos
-
 Latvia
-
 Lebanon
-
 Lesotho
-
 Libya
Libya
-
 Lithuania
-
 Luxembourg
-
 Madagascar
-
 Malaysia
-
 Malta
Malta
-
 Mauritius
-
 Mexico
-
 Moldova
-
 Mongolia
-
 Montenegro
-
 Morocco
-
 Mozambique
-
 Myanmar
-
 Namibia
-
 Nepal
Nepal
-
 Netherlands
-
 New Zealand
-
 Nigeria
-
 North Macedonia
-
 Norway
-
 Oman
Oman
-
 Pakistan
-
 Palestine
-
 Panama
-
 Papua New Guinea
-
 Paraguay
-
 Peru
Peru
-
 Philippines
-
 Poland
-
 Portugal
-
 Puerto Rico
-
 Qatar
Qatar
-
 Reunion
-
 Romania
-
 Rwanda
-
 Saudi Arabia
-
 Serbia
-
 Singapore
-
 Slovakia
-
 Slovenia
-
 Somalia
-
 South Africa
-
 Spain
Spain
-
 Sri Lanka
-
 Sweden
-
 Switzerland
-
 Syria
Syria
-
 Taiwan
-
 Tajikistan
-
 Tanzania
-
 Thailand
-
 Trinidad and Tobago
-
 Tunisia
-
 Turkey
-
 UAE
UAE
-
 Uganda
-
 Ukraine
-
 United Kingdom
-
United States
-
 Uruguay
-
 Uzbekistan
-
 Venezuela
-
 Vietnam
-
 Yemen
Yemen
-
 Zambia
-
 Zimbabwe
- Forex
- Crypto











