
ETH climbs around 1.5% after Fidelity's FETH product attracts majority of inflows

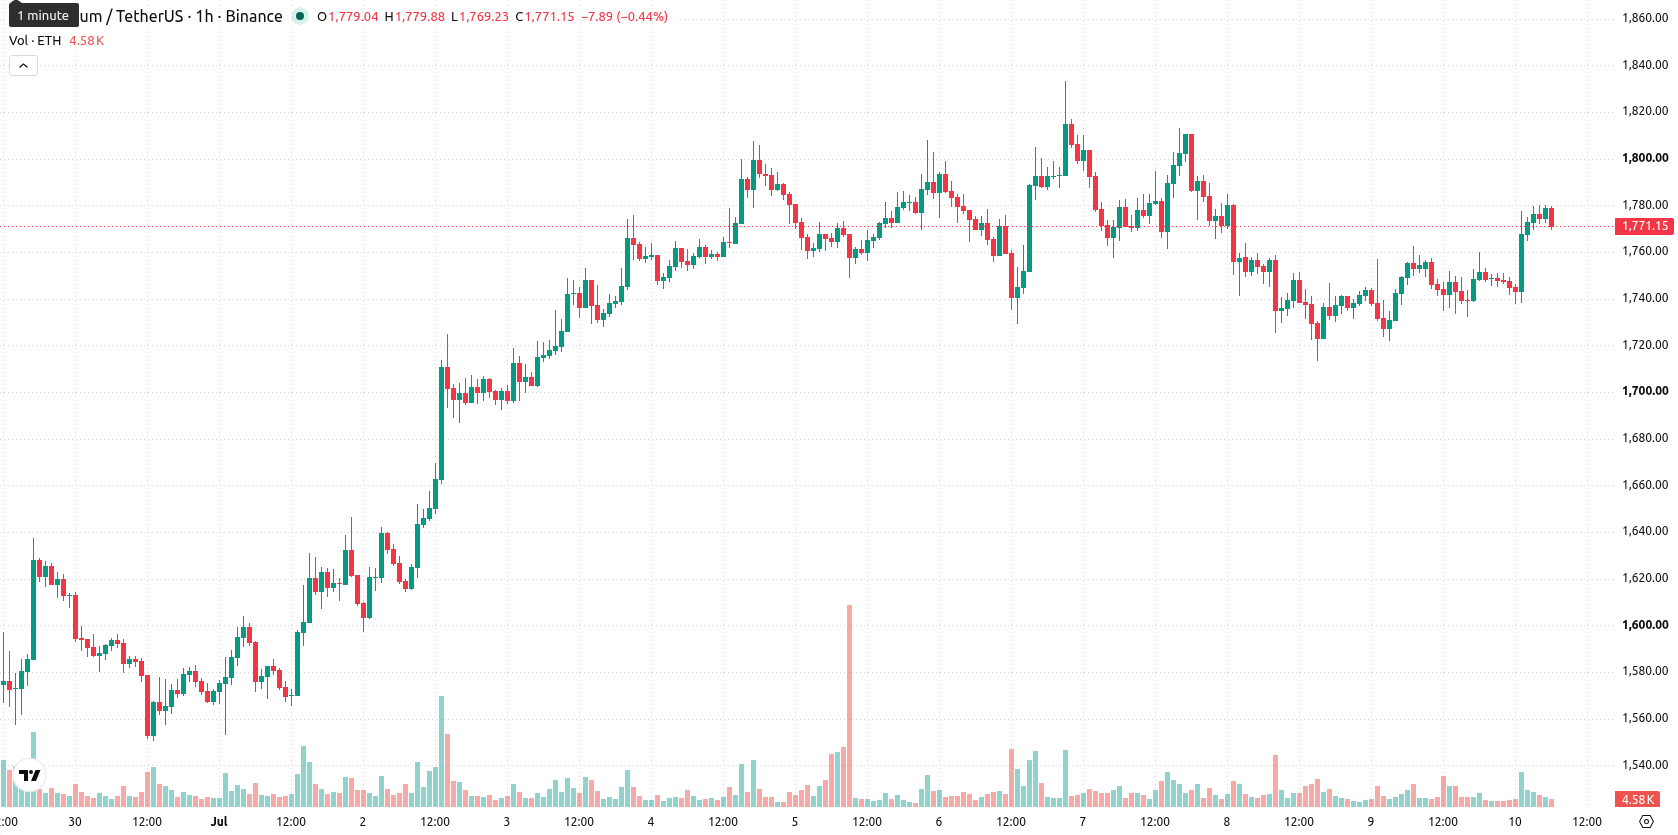
Ethereum (ETH) is trading at $1,774.46, up 1.44% on the day. The asset is positioned above its key short- and medium-term moving averages, while remaining below its long-term trend levels.
 1794.94
1833.40
1794.94
1833.40
Highlights
- US spot Ethereum ETFs drew $70.5 million in net inflows on July 8, led by strong allocations to Fidelity’s FETH product.
- Institutional demand has driven five consecutive sessions of net inflows totaling $91.5 million, enhancing ETH market liquidity and investor participation.
- ETH/USD shows powerful short-term bullish momentum with overbought conditions; price expected to range between $1,747 and $1,822 amid low downside risk.
Institutional inflows rise as spot ETF demand intensifies
US spot Ethereum ETFs attracted a fresh net inflow of $70.5 million on July 8, with the majority of new capital directed to Fidelity's FETH product, according to Cryptonews. This wave of ETF inflows, totaling $91.5 million over the past four days as reported by Coincentral, underscores a strong streak of institutional buying that has sustained for five consecutive sessions. The reversal, marking the first four-day series of net inflows since early May, improves market liquidity and broadens Ethereum's appeal to large investors.
Overbought signals emerge as momentum meets resistance
Technically, ETH/USD is trading above the 20-period ($1,752) and 50-period ($1,746) moving averages on the hourly chart, while remaining below the 200-period moving average ($2,240) on the daily timeframe. Immediate support is provided by the Ichimoku Kijun at $1,755, with further downside buffered by the $1,747 level. Resistance is visible near $1,822. Relative Strength Index (RSI) is elevated at 69.85, signaling strong upward momentum, while the Moving Average Convergence Divergence (MACD) and Awesome Oscillator both indicate positive bias. However, Stochastic RSI, Commodity Channel Index (CCI), and Bull/Bear Power are all highlighting overbought conditions, suggesting a risk of near-term pullback or consolidation. The Average Directional Index (ADX) reads as neutral, indicating ambiguous trend strength.
Sideways trading expected as upside breakout risk grows
In the short term, ETH is likely to fluctuate between $1,747 and $1,822 over the next two to three trading days, with a high probability of price action favoring further gains and limited downside risk. The baseline scenario anticipates movement within a sideways corridor in line with typical volatility at current levels. A breakout above $1,822 could open the way for further upside targets, while a break below the $1,747–$1,755 support zone would signal a shift in short-term momentum.
Earlier, analysts noted that Ethereum was displaying resilience in the face of geopolitical stress, with technical signals highlighting indecision and the potential for range-bound trading. The latest surge in institutional inflows via U.S. spot ETFs adds fresh momentum and liquidity, suggesting traders should closely monitor the $1,822 resistance as a potential trigger for an upside breakout.



Latest Ethereum News







-
 Afghanistan
-
 Albania
-
 Algeria
-
 Angola
-
 Argentina
-
 Armenia
-
 Australia
-
 Austria
-
 Azerbaijan
-
 Bahamas
-
 Bahrain
-
 Bangladesh
-
 Belarus
-
 Belgium
-
 Bolivia
-
 Botswana
-
 Brazil
-
 Brunei
-
 Bulgaria
-
 Cambodia
-
 Cameroon
-
 Canada
-
 Chile
Chile
-
 China
China
-
 Colombia
-
 Congo
Congo
-
 Costa Rica
-
 Cote d'Ivoire
-
 Croatia
-
 Cuba
Cuba
-
 Cyprus
-
 Czechia
-
 DR Congo
-
 Denmark
-
 Dominican Republic
-
 Ecuador
-
 Egypt
Egypt
-
 El Salvador
-
 Estonia
-
 Eswatini
-
 Ethiopia
-
 Finland
-
 France
-
 Georgia
-
 Germany
-
 Ghana
Ghana
-
 Greece
-
 Haiti
Haiti
-
 Hong Kong
-
 Hungary
-
 India
India
-
 Indonesia
-
 Iran, Islamic republic
-
 Iraq
Iraq
-
 Ireland
-
 Israel
-
 Italy
Italy
-
 Jamaica
-
 Japan
Japan
-
 Jordan
-
 Kazakhstan
-
 Kenya
Kenya
-
 Korea
Korea
-
 Kuwait
-
 Kyrgyzstan
-
 Laos
Laos
-
 Latvia
-
 Lebanon
-
 Lesotho
-
 Libya
Libya
-
 Lithuania
-
 Luxembourg
-
 Madagascar
-
 Malaysia
-
 Malta
Malta
-
 Mauritius
-
 Mexico
-
 Moldova
-
 Mongolia
-
 Montenegro
-
 Morocco
-
 Mozambique
-
 Myanmar
-
 Namibia
-
 Nepal
Nepal
-
 Netherlands
-
 New Zealand
-
 Nigeria
-
 North Macedonia
-
 Norway
-
 Oman
Oman
-
 Pakistan
-
 Palestine
-
 Panama
-
 Papua New Guinea
-
 Paraguay
-
 Peru
Peru
-
 Philippines
-
 Poland
-
 Portugal
-
 Puerto Rico
-
 Qatar
Qatar
-
 Reunion
-
 Romania
-
 Rwanda
-
 Saudi Arabia
-
 Serbia
-
 Singapore
-
 Slovakia
-
 Slovenia
-
 Somalia
-
 South Africa
-
 Spain
Spain
-
 Sri Lanka
-
 Sweden
-
 Switzerland
-
 Syria
Syria
-
 Taiwan
-
 Tajikistan
-
 Tanzania
-
 Thailand
-
 Trinidad and Tobago
-
 Tunisia
-
 Turkey
-
 UAE
UAE
-
 Uganda
-
 Ukraine
-
 United Kingdom
-
United States
-
 Uruguay
-
 Uzbekistan
-
 Venezuela
-
 Vietnam
-
 Yemen
Yemen
-
 Zambia
-
 Zimbabwe
- Forex
- Crypto











