
Arbitrum rebounds but remains below MA-20 resistance at $0.1008: weekly analysis

Arbitrum (ARB) is currently trading at $0.093, having gained $0.015 or 19.49% over the past week. The asset remains below both the weekly MA-20 at $0.1008 and the MA-50 at $0.2223, signaling ongoing medium- and long-term downward pressure despite the sharp rebound.
 0.0958
0.0914
0.0958
0.0914
Highlights
- ARB trades below key weekly moving averages, signaling persistent medium- and long-term downward momentum despite a recent short-term rebound.
- Technical indicators remain broadly bearish, with weak momentum and sellers dominating, while the asset hovers near oversold territory.
- Price is expected to range between $0.074 and $0.112 over the next week, with probability of further gains below 20% and consolidation favored unless $0.102 is breached.
Ecosystem revenue outlook strengthens as Robinhood Chain launches on Arbitrum
Arbitrum saw a fundamental shift in its ecosystem with the mainnet launch of Robinhood Chain, an Ethereum Layer-2 blockchain developed on Arbitrum's Orbit technology. Robinhood Chain introduced a new fee-sharing model that will direct 10% of its net protocol revenue back into the Arbitrum ecosystem — 8% flowing to the DAO treasury and 2% to the Developer Guild. This approach extends to all current and future Orbit-based Layer-2 networks, providing ARB holders with a sustained external revenue stream. The model was confirmed by Offchain Labs, supporting long-term value accrual for ARB.
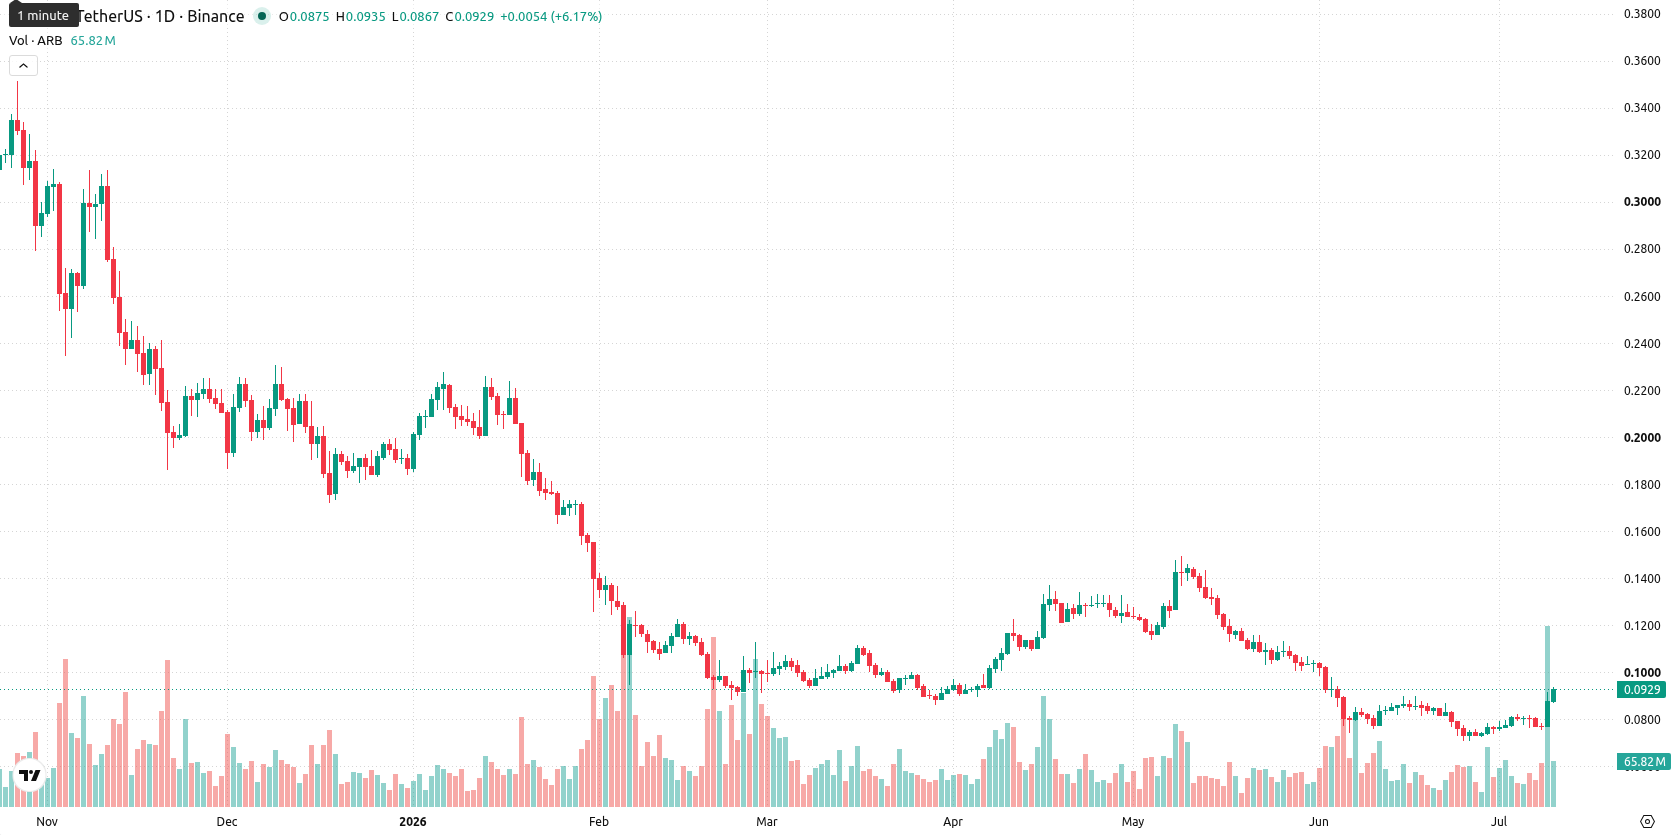
Persistent bearish momentum over the week as indicators near oversold
On the weekly timeframe, technical indicators remain bearish despite the recent price surge. ARB trades below both the MA-20 ($0.1008) and MA-50 ($0.2223), with the Ichimoku Kijun well above the market, limiting upside reference points. Weekly oscillators show RSI at 38.11 and CCI at -77.20, suggesting ARB approaches oversold territory, while MACD and ADX highlight ongoing selling momentum. Stochastic RSI is neutral and Bull/Bear Power confirms continued seller dominance, although volatility over the past week reached 21.54%.
Limited upside next week as key signals show low breakout odds
For the next seven days, ARB is expected to trade between $0.074 and $0.112. Given that none of the four key weekly indicators signal a Buy or Strong Buy, the probability of additional price gains is low — less than 20%. A sideways pattern could see consolidation between the $0.082 support and $0.102 resistance, while a sustained move above $0.102 would point to an unlikely bullish scenario. In contrast, renewed selling pressure may push the price below $0.082.
Earlier, analysts noted that Arbitrum was exhibiting signs of bullish momentum despite lingering structural resistance, driven by renewed protocol earnings and ecosystem integration. The latest weekly data, however, underscores persistent downward pressure and limited buy signals, making it crucial for traders to monitor potential breakdowns below the $0.082 support as the key near-term risk.









-
 Afghanistan
-
 Albania
-
 Algeria
-
 Angola
-
 Argentina
-
 Armenia
-
 Australia
-
 Austria
-
 Azerbaijan
-
 Bahamas
-
 Bahrain
-
 Bangladesh
-
 Belarus
-
 Belgium
-
 Bolivia
-
 Botswana
-
 Brazil
-
 Brunei
-
 Bulgaria
-
 Cambodia
-
 Cameroon
-
 Canada
-
 Chile
Chile
-
 China
China
-
 Colombia
-
 Congo
Congo
-
 Costa Rica
-
 Cote d'Ivoire
-
 Croatia
-
 Cuba
Cuba
-
 Cyprus
-
 Czechia
-
 DR Congo
-
 Denmark
-
 Dominican Republic
-
 Ecuador
-
 Egypt
Egypt
-
 El Salvador
-
 Estonia
-
 Eswatini
-
 Ethiopia
-
 Finland
-
 France
-
 Georgia
-
 Germany
-
 Ghana
Ghana
-
 Greece
-
 Haiti
Haiti
-
 Hong Kong
-
 Hungary
-
 India
India
-
 Indonesia
-
 Iran, Islamic republic
-
 Iraq
Iraq
-
 Ireland
-
 Israel
-
 Italy
Italy
-
 Jamaica
-
 Japan
Japan
-
 Jordan
-
 Kazakhstan
-
 Kenya
Kenya
-
 Korea
Korea
-
 Kuwait
-
 Kyrgyzstan
-
 Laos
Laos
-
 Latvia
-
 Lebanon
-
 Lesotho
-
 Libya
Libya
-
 Lithuania
-
 Luxembourg
-
 Madagascar
-
 Malaysia
-
 Malta
Malta
-
 Mauritius
-
 Mexico
-
 Moldova
-
 Mongolia
-
 Montenegro
-
 Morocco
-
 Mozambique
-
 Myanmar
-
 Namibia
-
 Nepal
Nepal
-
 Netherlands
-
 New Zealand
-
 Nigeria
-
 North Macedonia
-
 Norway
-
 Oman
Oman
-
 Pakistan
-
 Palestine
-
 Panama
-
 Papua New Guinea
-
 Paraguay
-
 Peru
Peru
-
 Philippines
-
 Poland
-
 Portugal
-
 Puerto Rico
-
 Qatar
Qatar
-
 Reunion
-
 Romania
-
 Rwanda
-
 Saudi Arabia
-
 Serbia
-
 Singapore
-
 Slovakia
-
 Slovenia
-
 Somalia
-
 South Africa
-
 Spain
Spain
-
 Sri Lanka
-
 Sweden
-
 Switzerland
-
 Syria
Syria
-
 Taiwan
-
 Tajikistan
-
 Tanzania
-
 Thailand
-
 Trinidad and Tobago
-
 Tunisia
-
 Turkey
-
 UAE
UAE
-
 Uganda
-
 Ukraine
-
 United Kingdom
-
United States
-
 Uruguay
-
 Uzbekistan
-
 Venezuela
-
 Vietnam
-
 Yemen
Yemen
-
 Zambia
-
 Zimbabwe
- Forex
- Crypto











