
Why is Bitcoin flat today? Failed breakout risk around the $64,103 resistance

Bitcoin (BTC) is trading at $63,955, marking a slight decline in today's session. The asset remains below its key moving averages amid subdued daily activity.
 64425
64692.83
64425
64692.83
Highlights
- U.S. spot Bitcoin ETFs saw net inflows of $197.4 million last week, indicating renewed institutional engagement as prices softened.
- Large investors accumulated over 270,000 BTC worth $16 billion during June lows, while Empery Digital’s $87.1 million sale injected short-term liquidity.
- BTC/USD trades below key moving averages with weak directional momentum, likely holding in a $62,782–$64,714 range and 72% probability of further downside.
Institutional inflows and debt-driven sales shift exposure dynamics
U.S. spot Bitcoin ETFs recorded net weekly inflows of approximately $197.4 million during the five trading days ending Friday, signaling renewed institutional participation, according to Theblock. Finance Biggo reported that large holders accumulated over 270,000 BTC, valued at more than $16 billion, amid June's market lows, pointing to concentrated capital deployment and a willingness among investors to increase exposure as prices softened. Separately, Empery Digital sold 1,400 BTC for about $87.1 million on July 7 to repay debt and invest in AI infrastructure, as noted by Cryptonomist, resulting in a short-term liquidity event. These developments reflect evolving institutional activity against a background of modest market movement.
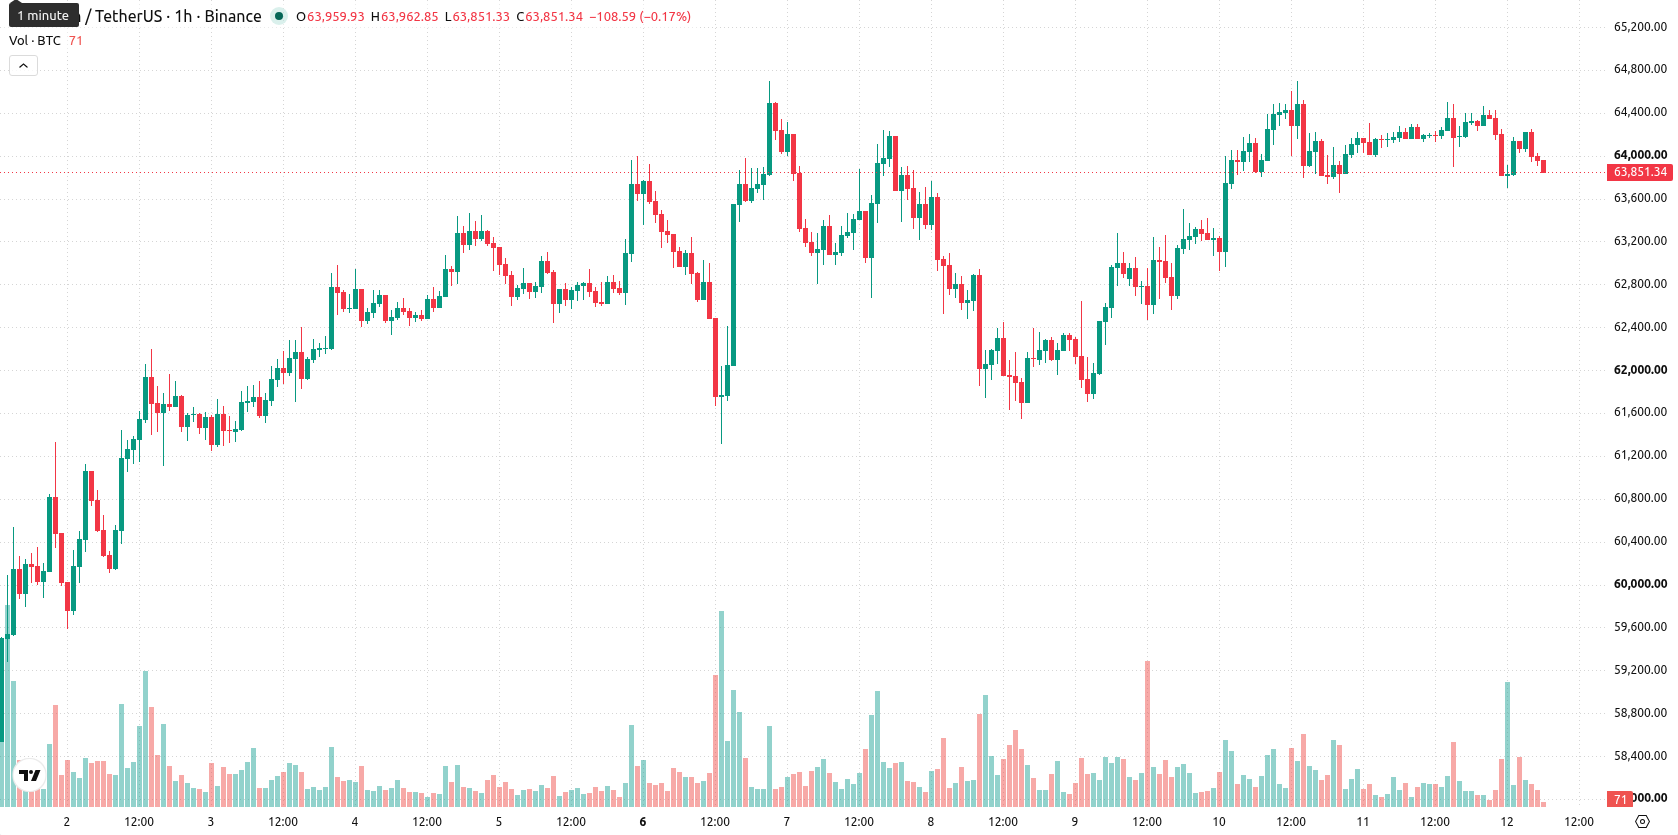
Mixed signals as bearish oscillators contend with overbought intraday buyers
BTC remains capped below the MA-20 and MA-50 on the hourly chart and is also trading under the MA-200 on the daily timeframe. The Ichimoku Kijun level at $64,103 now acts as immediate resistance. Momentum indicators show a neutral bias from both the Moving Average Convergence Divergence (MACD) and the Average Directional Index (ADX), implying the trend lacks conviction. The Relative Strength Index (RSI), Stochastic RSI, and Commodity Channel Index (CCI) are all positioned in the Sell zone, suggesting bearish momentum continues to dominate, while Bull/Bear Power points to buyer influence with intraday conditions classified as overbought. The Awesome Oscillator is neutral and does not reinforce any specific trend direction. Overall, oscillators and momentum signals are mixed, and volatility remains low.
Downside bias prevails as sideways consolidation remains the base case
Over the next 2 to 3 trading days, the anticipated price range for BTC is $62,782 to $64,714. With a 72% probability, further downside is expected to prevail, while the likelihood of a move higher stands at 28%. The base case scenario involves Bitcoin consolidating in a sideways range; a rally would require a break above the $64,103 resistance, while increased selling could trigger a move below the lower end of the short-term volatility band.
Earlier, analysts noted that Bitcoin was experiencing stabilization as whale accumulation helped offset institutional selling, with mixed technical indicators suggesting a lack of clear trend direction. The latest developments reinforce this narrative, but with downside risks prevailing amid bearish momentum, traders should closely monitor for a potential break below short-term volatility support as a signal for renewed market movement.








-
 Afghanistan
-
 Albania
-
 Algeria
-
 Angola
-
 Argentina
-
 Armenia
-
 Australia
-
 Austria
-
 Azerbaijan
-
 Bahamas
-
 Bahrain
-
 Bangladesh
-
 Belarus
-
 Belgium
-
 Bolivia
-
 Botswana
-
 Brazil
-
 Brunei
-
 Bulgaria
-
 Cambodia
-
 Cameroon
-
 Canada
-
 Chile
Chile
-
 China
China
-
 Colombia
-
 Congo
Congo
-
 Costa Rica
-
 Cote d'Ivoire
-
 Croatia
-
 Cuba
Cuba
-
 Cyprus
-
 Czechia
-
 DR Congo
-
 Denmark
-
 Dominican Republic
-
 Ecuador
-
 Egypt
Egypt
-
 El Salvador
-
 Estonia
-
 Eswatini
-
 Ethiopia
-
 Finland
-
 France
-
 Georgia
-
 Germany
-
 Ghana
Ghana
-
 Greece
-
 Haiti
Haiti
-
 Hong Kong
-
 Hungary
-
 India
India
-
 Indonesia
-
 Iran, Islamic republic
-
 Iraq
Iraq
-
 Ireland
-
 Israel
-
 Italy
Italy
-
 Jamaica
-
 Japan
Japan
-
 Jordan
-
 Kazakhstan
-
 Kenya
Kenya
-
 Korea
Korea
-
 Kuwait
-
 Kyrgyzstan
-
 Laos
Laos
-
 Latvia
-
 Lebanon
-
 Lesotho
-
 Libya
Libya
-
 Lithuania
-
 Luxembourg
-
 Madagascar
-
 Malaysia
-
 Malta
Malta
-
 Mauritius
-
 Mexico
-
 Moldova
-
 Mongolia
-
 Montenegro
-
 Morocco
-
 Mozambique
-
 Myanmar
-
 Namibia
-
 Nepal
Nepal
-
 Netherlands
-
 New Zealand
-
 Nigeria
-
 North Macedonia
-
 Norway
-
 Oman
Oman
-
 Pakistan
-
 Palestine
-
 Panama
-
 Papua New Guinea
-
 Paraguay
-
 Peru
Peru
-
 Philippines
-
 Poland
-
 Portugal
-
 Puerto Rico
-
 Qatar
Qatar
-
 Reunion
-
 Romania
-
 Rwanda
-
 Saudi Arabia
-
 Serbia
-
 Singapore
-
 Slovakia
-
 Slovenia
-
 Somalia
-
 South Africa
-
 Spain
Spain
-
 Sri Lanka
-
 Sweden
-
 Switzerland
-
 Syria
Syria
-
 Taiwan
-
 Tajikistan
-
 Tanzania
-
 Thailand
-
 Trinidad and Tobago
-
 Tunisia
-
 Turkey
-
 UAE
UAE
-
 Uganda
-
 Ukraine
-
 United Kingdom
-
United States
-
 Uruguay
-
 Uzbekistan
-
 Venezuela
-
 Vietnam
-
 Yemen
Yemen
-
 Zambia
-
 Zimbabwe
- Forex
- Crypto











