
Bitcoin trades near $64,996 resistance after ETF-friendly reforms in Japan

Bitcoin (BTC) is trading at $64,917, posting a narrow daily move with a marginal gain. The price is currently positioned above its key short- and medium-term moving averages but still sits beneath a major long-term average.
 64997.52
65600.00
64997.52
65600.00
Highlights
- Japan's new law classifies cryptocurrencies as financial assets and cuts the top crypto tax rate to a flat 20%, improving institutional and retail market access.
- Spot Bitcoin ETFs in the U.S. saw net inflows of $181 million on July 15, signaling renewed investor interest amid recent outflows.
- BTC/USD is consolidating between $64,073 and $66,122, with mixed momentum and a 60% probability of near-term upward movement despite prevailing uncertainty.
Demand outlook shifts as Japan’s policy overhaul boosts ETF prospects
Japanese lawmakers have enacted new legislation to reclassify Bitcoin and other cryptocurrencies as financial assets under the Financial Instruments and Exchange Act, paving the way for future spot Bitcoin exchange-traded funds while reducing the top crypto income tax rate from up to 55% down to a flat 20%, according to Bitcoinmagazine. The regulatory overhaul is expected to directly improve institutional accessibility and retail participation in the Japanese market, setting up long-term demand shifts for Bitcoin. In the U.S., spot Bitcoin ETFs saw net inflows of $181 million on July 15, as reported by Cryptoadventure, reflecting a partial recovery in fund flows following recent outflows amid regulatory and macroeconomic adjustments. These developments provide a firmer foundation for market participation on both sides of the Pacific.
Mixed momentum as key averages and resistance drive technical divergence
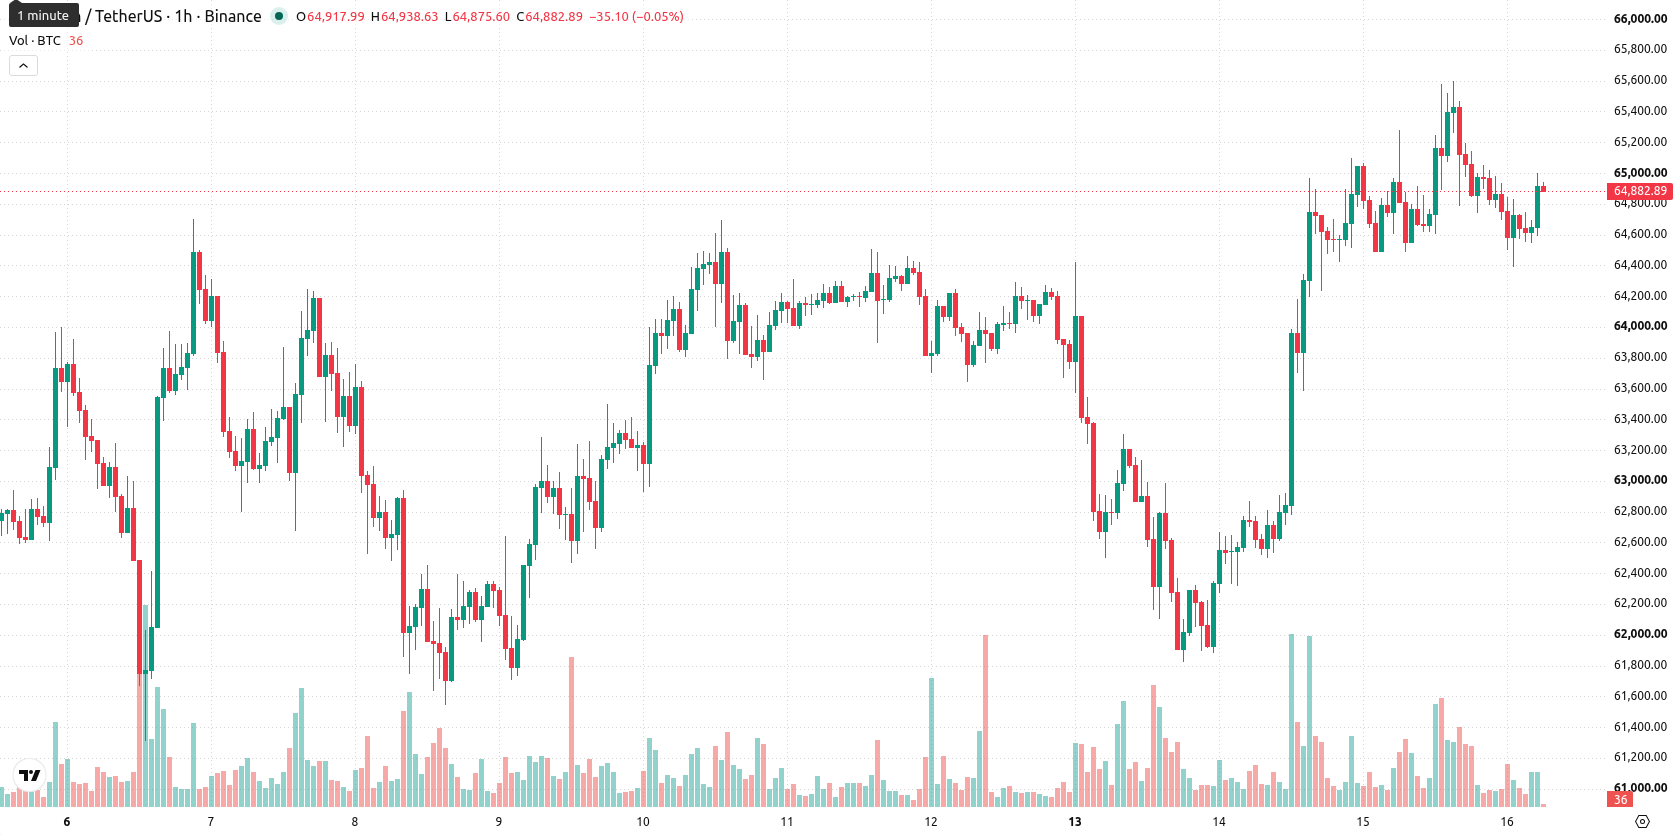
On the hourly chart, BTC/USD trades above the 20- and 50-period moving averages, while on the daily chart, it remains capped below the 200-period moving average. The Ichimoku Kijun sits immediately overhead as resistance at $64,996. Among momentum indicators, the Moving Average Convergence Divergence (MACD) signals strong bullish momentum, but the Average Directional Index (ADX) is neutral. The Relative Strength Index (RSI) and Commodity Channel Index (CCI) are both in sell zones, with the Stochastic RSI and Bull/Bear Power flagging oversold and seller-dominant conditions. The Awesome Oscillator also highlights a short-term bearish tone, underscoring the present uncertainty and mixed signals from technical tools.
Consolidation risk as breakout depends on resistance and volatility band
Over the next 2–3 trading days, BTC/USD is likely to trade within a projected range of $64,073 to $66,122. There is a 60% probability of price moving higher within this corridor, and a 40% chance of a downward move. The base case scenario is for Bitcoin to consolidate inside this volatility band. A bullish breakout would require a push above the Kijun resistance, potentially opening further upside, while a close below immediate support could lead to further selling pressure.
Earlier, analysts noted that Bitcoin remained highly sensitive to global macroeconomic shifts and fluctuating institutional sentiment, lacking a decisive breakout amid lingering uncertainty. With both Japanese regulatory reforms set to spur demand and recent ETF inflows signaling renewed institutional interest, traders should watch for a bullish confirmation above the Kijun resistance, which could signal a sustained move beyond the prevailing consolidation range.








-
 Afghanistan
-
 Albania
-
 Algeria
-
 Angola
-
 Argentina
-
 Armenia
-
 Australia
-
 Austria
-
 Azerbaijan
-
 Bahamas
-
 Bahrain
-
 Bangladesh
-
 Belarus
-
 Belgium
-
 Bolivia
-
 Botswana
-
 Brazil
-
 Brunei
-
 Bulgaria
-
 Cambodia
-
 Cameroon
-
 Canada
-
 Chile
Chile
-
 China
China
-
 Colombia
-
 Congo
Congo
-
 Costa Rica
-
 Cote d'Ivoire
-
 Croatia
-
 Cuba
Cuba
-
 Cyprus
-
 Czechia
-
 DR Congo
-
 Denmark
-
 Dominican Republic
-
 Ecuador
-
 Egypt
Egypt
-
 El Salvador
-
 Estonia
-
 Eswatini
-
 Ethiopia
-
 Finland
-
 France
-
 Georgia
-
 Germany
-
 Ghana
Ghana
-
 Greece
-
 Haiti
Haiti
-
 Hong Kong
-
 Hungary
-
 India
India
-
 Indonesia
-
 Iran, Islamic republic
-
 Iraq
Iraq
-
 Ireland
-
 Israel
-
 Italy
Italy
-
 Jamaica
-
 Japan
Japan
-
 Jordan
-
 Kazakhstan
-
 Kenya
Kenya
-
 Korea
Korea
-
 Kuwait
-
 Kyrgyzstan
-
 Laos
Laos
-
 Latvia
-
 Lebanon
-
 Lesotho
-
 Libya
Libya
-
 Lithuania
-
 Luxembourg
-
 Madagascar
-
 Malaysia
-
 Malta
Malta
-
 Mauritius
-
 Mexico
-
 Moldova
-
 Mongolia
-
 Montenegro
-
 Morocco
-
 Mozambique
-
 Myanmar
-
 Namibia
-
 Nepal
Nepal
-
 Netherlands
-
 New Zealand
-
 Nigeria
-
 North Macedonia
-
 Norway
-
 Oman
Oman
-
 Pakistan
-
 Palestine
-
 Panama
-
 Papua New Guinea
-
 Paraguay
-
 Peru
Peru
-
 Philippines
-
 Poland
-
 Portugal
-
 Puerto Rico
-
 Qatar
Qatar
-
 Reunion
-
 Romania
-
 Rwanda
-
 Saudi Arabia
-
 Serbia
-
 Singapore
-
 Slovakia
-
 Slovenia
-
 Somalia
-
 South Africa
-
 Spain
Spain
-
 Sri Lanka
-
 Sweden
-
 Switzerland
-
 Syria
Syria
-
 Taiwan
-
 Tajikistan
-
 Tanzania
-
 Thailand
-
 Trinidad and Tobago
-
 Tunisia
-
 Turkey
-
 UAE
UAE
-
 Uganda
-
 Ukraine
-
 United Kingdom
-
United States
-
 Uruguay
-
 Uzbekistan
-
 Venezuela
-
 Vietnam
-
 Yemen
Yemen
-
 Zambia
-
 Zimbabwe
- Forex
- Crypto











