
The Graph trades sideways to lower with resistance at $0.0180 as sellers dominate: weekly report

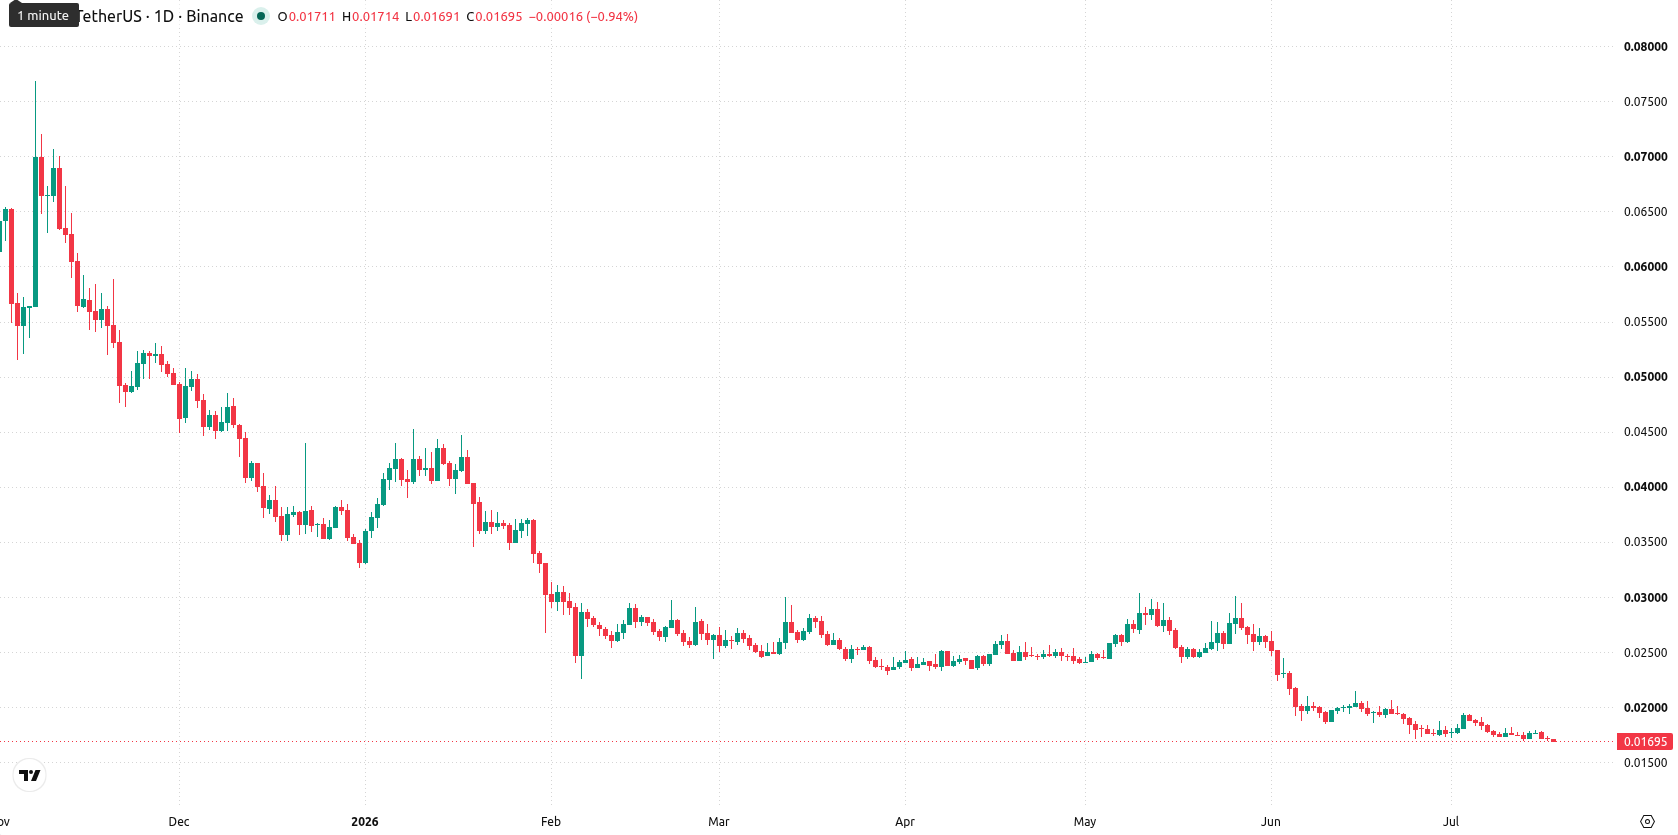
The Graph (GRT) recently closed at $0.01694, marking a decline of $0.0008 (4.40%) over the past week. The token remains firmly below its weekly MA-20 ($0.02281950), MA-50 ($0.04431880), and MA-200 ($0.12553820), indicating sustained bearish momentum and positioning the price at the very bottom of its weekly range.
 0.01714
0.01798000
0.01714
0.01798000
Highlights
- GRT remains entrenched in a bearish trend, trading well below key moving averages and dynamic resistance levels.
- Momentum indicators signal persistent downside pressure, with oversold readings confirming strong seller control and no recovery signs.
- For the next week, GRT is likely to range between $0.0160 and $0.0180, with downside risk dominant and less than 20% probability of upward reversal.
Bearish momentum persists as technical signals reinforce downside
Weekly technical analysis shows that GRT is trading well beneath all major moving averages on the W1 timeframe, underlining a strong bearish trend. The weekly support zone sits at $0.0160, while resistance is defined by the MA-20 near $0.0228 and a local ceiling at $0.0180. Downside momentum is confirmed by a Strong Sell signal from the MACD, an elevated ADX, and persistently negative Bull/Bear Power. Oversold signals from the RSI, Stochastic RSI, and CCI show that, while the market is stretched to the downside, sellers remain in control.
Sideways-to-lower range likely as bearish momentum dominates next week
For the next 7 days, the baseline scenario anticipates GRT trading within a sideways to lower range between $0.0160 and $0.0180, given ongoing negative momentum and W1 indicator direction. Should bearish pressure accelerate, a breakdown below $0.0160 is possible. Conversely, a reversal above $0.0180 would be needed to signal the beginning of a recovery, but this outcome appears unlikely as less than 20% of technical signals support a bullish case.
Earlier, analysts noted that The Graph remained locked in a strong bearish trend with little evidence of an imminent reversal. The latest analysis confirms this outlook and underscores that a sustained breakdown below the $0.0160 support could expose GRT to further downside risk in the near term.


Latest GRT News







-
 Afghanistan
-
 Albania
-
 Algeria
-
 Angola
-
 Argentina
-
 Armenia
-
 Australia
-
 Austria
-
 Azerbaijan
-
 Bahamas
-
 Bahrain
-
 Bangladesh
-
 Belarus
-
 Belgium
-
 Bolivia
-
 Botswana
-
 Brazil
-
 Brunei
-
 Bulgaria
-
 Cambodia
-
 Cameroon
-
 Canada
-
 Chile
Chile
-
 China
China
-
 Colombia
-
 Congo
Congo
-
 Costa Rica
-
 Cote d'Ivoire
-
 Croatia
-
 Cuba
Cuba
-
 Cyprus
-
 Czechia
-
 DR Congo
-
 Denmark
-
 Dominican Republic
-
 Ecuador
-
 Egypt
Egypt
-
 El Salvador
-
 Estonia
-
 Eswatini
-
 Ethiopia
-
 Finland
-
 France
-
 Georgia
-
 Germany
-
 Ghana
Ghana
-
 Greece
-
 Haiti
Haiti
-
 Hong Kong
-
 Hungary
-
 India
India
-
 Indonesia
-
 Iran, Islamic republic
-
 Iraq
Iraq
-
 Ireland
-
 Israel
-
 Italy
Italy
-
 Jamaica
-
 Japan
Japan
-
 Jordan
-
 Kazakhstan
-
 Kenya
Kenya
-
 Korea
Korea
-
 Kuwait
-
 Kyrgyzstan
-
 Laos
Laos
-
 Latvia
-
 Lebanon
-
 Lesotho
-
 Libya
Libya
-
 Lithuania
-
 Luxembourg
-
 Madagascar
-
 Malaysia
-
 Malta
Malta
-
 Mauritius
-
 Mexico
-
 Moldova
-
 Mongolia
-
 Montenegro
-
 Morocco
-
 Mozambique
-
 Myanmar
-
 Namibia
-
 Nepal
Nepal
-
 Netherlands
-
 New Zealand
-
 Nigeria
-
 North Macedonia
-
 Norway
-
 Oman
Oman
-
 Pakistan
-
 Palestine
-
 Panama
-
 Papua New Guinea
-
 Paraguay
-
 Peru
Peru
-
 Philippines
-
 Poland
-
 Portugal
-
 Puerto Rico
-
 Qatar
Qatar
-
 Reunion
-
 Romania
-
 Rwanda
-
 Saudi Arabia
-
 Serbia
-
 Singapore
-
 Slovakia
-
 Slovenia
-
 Somalia
-
 South Africa
-
 Spain
Spain
-
 Sri Lanka
-
 Sweden
-
 Switzerland
-
 Syria
Syria
-
 Taiwan
-
 Tajikistan
-
 Tanzania
-
 Thailand
-
 Trinidad and Tobago
-
 Tunisia
-
 Turkey
-
 UAE
UAE
-
 Uganda
-
 Ukraine
-
 United Kingdom
-
United States
-
 Uruguay
-
 Uzbekistan
-
 Venezuela
-
 Vietnam
-
 Yemen
Yemen
-
 Zambia
-
 Zimbabwe
- Forex
- Crypto











