
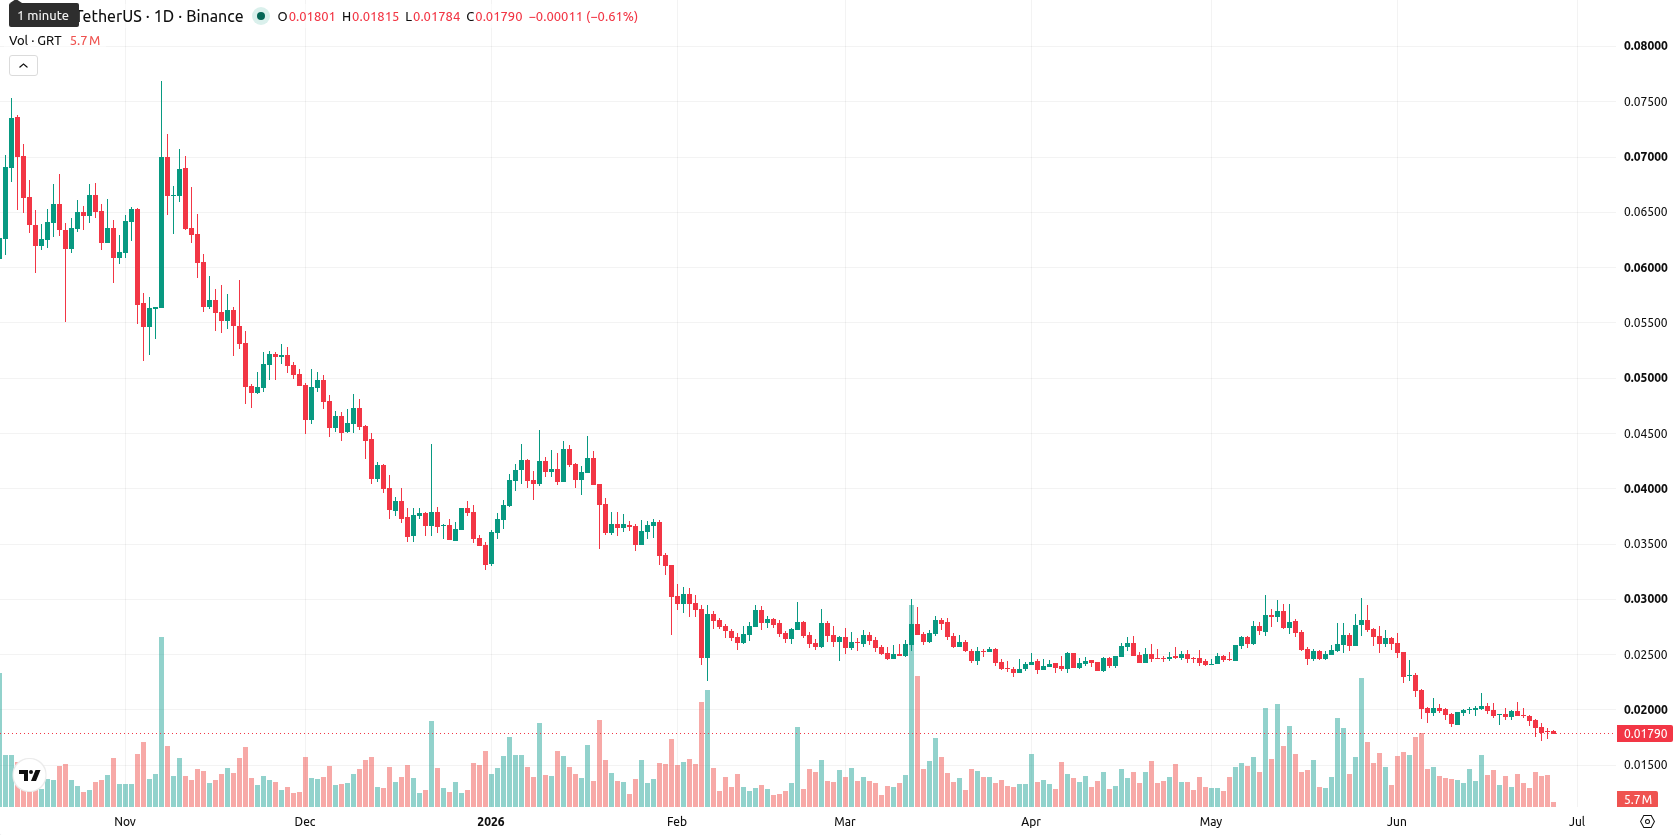
The Graph extends slide as price falls below key moving averages: weekly outlook

The Graph (GRT) is trading at $0.0179 after a decline of $0.0016, or 8.21%, over the past week. The asset remains significantly below its weekly MA-20, MA-50, and MA-200 levels, underscoring persistent downside pressure in the medium- and long-term trends.
Highlights
- GRT trades under heavy downside pressure, currently well below major moving average resistance levels across all timeframes.
- All key momentum indicators confirm a strong bearish trend, with weekly technicals showing the asset is deeply oversold.
- Expected seven-day price range is $0.0170 to $0.0216, with risk skewed toward further declines and new lows if $0.0170 breaks.
Bearish technical momentum intensifies with oversold signals this week
On the weekly (W1) chart, all key momentum signals for GRT are strongly bearish. The price is well below major moving averages, with the nearest resistance now set by the MA-20 at $0.02418650 and support emerging near recent lows. Weekly RSI is in oversold territory, while the Stochastic RSI and CCI also indicate severe oversold conditions. MACD remains in strong sell mode, ADX above 26 confirms a solid downtrend, and both Bull/Bear Power and the Awesome Oscillator reinforce the dominance of selling pressure.
Downside risk prevails as technical weakness persists next week
For the next 7 days, continued bearish momentum is expected for GRT, with the price forecast to move within the $0.0170 to $0.0216 range. Given the alignment of weekly technical indicators and a lack of buy signals, the probability of a significant upward move remains below 20%. The base scenario is for further consolidation near the lower end of the range, while a sustained break below $0.0170 would indicate risk of new yearly lows. A recovery above $0.0216 would be needed to signal any bullish reversal attempts.
Earlier, analysts noted that assets facing sustained technical pressure and lacking bullish momentum signals were likely to continue consolidating or facing downside risks. The current setup for The Graph reinforces this view, with all major indicators pointing to persistent bearish momentum, making a clear recovery above the $0.0216 resistance level the key factor to watch for any short-term reversal.


-
 Afghanistan
-
 Albania
-
 Algeria
-
 Angola
-
 Argentina
-
 Armenia
-
 Australia
-
 Austria
-
 Azerbaijan
-
 Bahamas
-
 Bahrain
-
 Bangladesh
-
 Belarus
-
 Belgium
-
 Bolivia
-
 Botswana
-
 Brazil
-
 Brunei
-
 Bulgaria
-
 Cambodia
-
 Cameroon
-
 Canada
-
 Chile
Chile
-
 China
China
-
 Colombia
-
 Congo
Congo
-
 Costa Rica
-
 Cote d'Ivoire
-
 Croatia
-
 Cuba
Cuba
-
 Cyprus
-
 Czechia
-
 DR Congo
-
 Denmark
-
 Dominican Republic
-
 Ecuador
-
 Egypt
Egypt
-
 El Salvador
-
 Estonia
-
 Eswatini
-
 Ethiopia
-
 Finland
-
 France
-
 Georgia
-
 Germany
-
 Ghana
Ghana
-
 Greece
-
 Haiti
Haiti
-
 Hong Kong
-
 Hungary
-
 India
India
-
 Indonesia
-
 Iran, Islamic republic
-
 Iraq
Iraq
-
 Ireland
-
 Israel
-
 Italy
Italy
-
 Jamaica
-
 Japan
Japan
-
 Jordan
-
 Kazakhstan
-
 Kenya
Kenya
-
 Korea
Korea
-
 Kuwait
-
 Kyrgyzstan
-
 Laos
Laos
-
 Latvia
-
 Lebanon
-
 Lesotho
-
 Libya
Libya
-
 Lithuania
-
 Luxembourg
-
 Madagascar
-
 Malaysia
-
 Malta
Malta
-
 Mauritius
-
 Mexico
-
 Moldova
-
 Mongolia
-
 Montenegro
-
 Morocco
-
 Mozambique
-
 Myanmar
-
 Namibia
-
 Nepal
Nepal
-
 Netherlands
-
 New Zealand
-
 Nigeria
-
 North Macedonia
-
 Norway
-
 Oman
Oman
-
 Pakistan
-
 Palestine
-
 Panama
-
 Papua New Guinea
-
 Paraguay
-
 Peru
Peru
-
 Philippines
-
 Poland
-
 Portugal
-
 Puerto Rico
-
 Qatar
Qatar
-
 Reunion
-
 Romania
-
 Rwanda
-
 Saudi Arabia
-
 Serbia
-
 Singapore
-
 Slovakia
-
 Slovenia
-
 Somalia
-
 South Africa
-
 Spain
Spain
-
 Sri Lanka
-
 Sweden
-
 Switzerland
-
 Syria
Syria
-
 Taiwan
-
 Tajikistan
-
 Tanzania
-
 Thailand
-
 Trinidad and Tobago
-
 Tunisia
-
 Turkey
-
 UAE
UAE
-
 Uganda
-
 Ukraine
-
 United Kingdom
-
United States
-
 Uruguay
-
 Uzbekistan
-
 Venezuela
-
 Vietnam
-
 Yemen
Yemen
-
 Zambia
-
 Zimbabwe
- Forex
- Crypto
