
GRT hovers near recent lows with RSI deep in oversold territory: weekly analysis

The Graph (GRT) is currently trading at $0.01574, showing a decline of $0.0012 (7.08%) over the past week. The asset remains significantly below its weekly MA-20 ($0.02234600), MA-50 ($0.04263680), and MA-200 ($0.12510770), with the MA-20 acting as the closest resistance, underlining a persistent bearish structure on the weekly timeframe.
 0.01629
0.01697000
0.01629
0.01697000
Highlights
- GRT remains in a pronounced downtrend, trading below all major moving averages and confirming medium- to long-term bearish momentum.
- Momentum and trend indicators continue to signal strong selling dominance, though deeply oversold readings suggest potential for a brief relief bounce.
- The anticipated trading range for the week is $0.01445–$0.01705, with further declines more likely unless a decisive breakout above resistance occurs.
Bearish momentum intensifies during the week as indicators hit extremes
Momentum signals are strongly negative on the weekly chart: MACD confirms a strong sell, the ADX supports ongoing downside momentum, and the RSI stands deeply oversold at 27.53. The Stochastic RSI and CCI are also maximally oversold and deeply negative, while Bull/Bear Power aligns with sellers dominating the trend. The Awesome Oscillator remains neutral, signaling a lack of any meaningful bullish reversal attempts, as GRT closes the week at the bottom of its trading range and marks volatility at 8.27%.
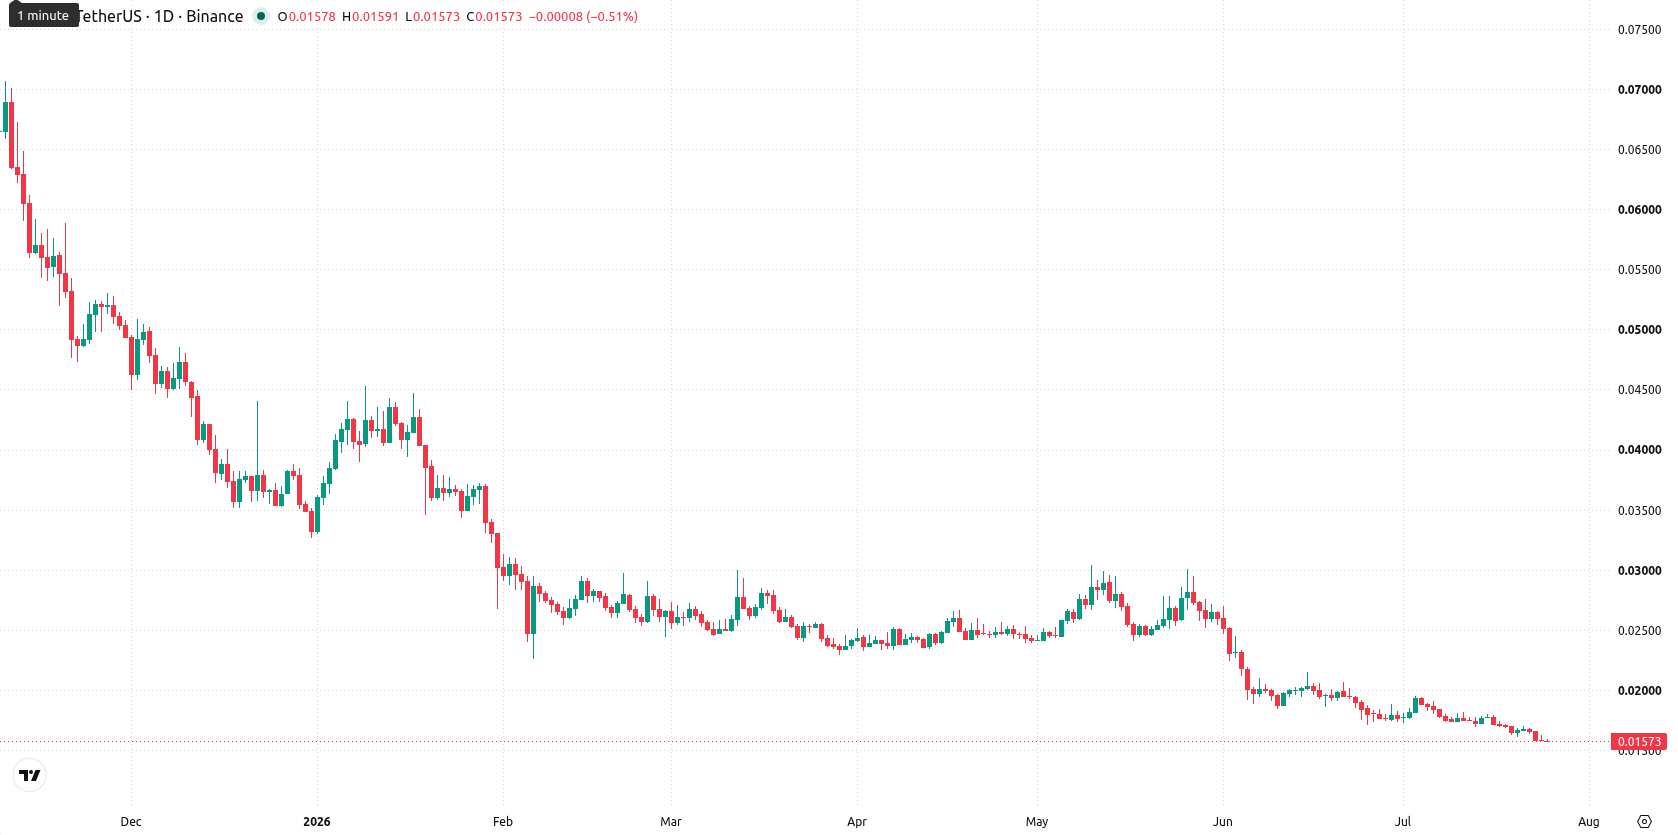
Range-bound trade expected next week as oversold pressures persist
In the next 7 days, GRT is expected to trade within a range of $0.01445 – $0.01705, just beneath its current level. With all major weekly indicators still pointed lower and no buy signals present, the likelihood of a sustained rally is below 20%. The baseline scenario calls for continued consolidation in this band as oversold conditions linger. A break above $0.01705 may trigger short covering, while any sustained move below $0.01445 would reinforce the downtrend.
Earlier, analysts noted that The Graph was locked in a prolonged bearish trend with little evidence of imminent recovery. Fresh technical signals in the current period reinforce this outlook, as deepening oversold conditions and persistent downside momentum place extra emphasis on monitoring for a decisive break below $0.01445 as the next potential catalyst.









-
 Afghanistan
-
 Albania
-
 Algeria
-
 Angola
-
 Argentina
-
 Armenia
-
 Australia
-
 Austria
-
 Azerbaijan
-
 Bahamas
-
 Bahrain
-
 Bangladesh
-
 Belarus
-
 Belgium
-
 Bolivia
-
 Botswana
-
 Brazil
-
 Brunei
-
 Bulgaria
-
 Cambodia
-
 Cameroon
-
 Canada
-
 Chile
Chile
-
 China
China
-
 Colombia
-
 Congo
Congo
-
 Costa Rica
-
 Cote d'Ivoire
-
 Croatia
-
 Cuba
Cuba
-
 Cyprus
-
 Czechia
-
 DR Congo
-
 Denmark
-
 Dominican Republic
-
 Ecuador
-
 Egypt
Egypt
-
 El Salvador
-
 Estonia
-
 Eswatini
-
 Ethiopia
-
 Finland
-
 France
-
 Georgia
-
 Germany
-
 Ghana
Ghana
-
 Greece
-
 Haiti
Haiti
-
 Hong Kong
-
 Hungary
-
 India
India
-
 Indonesia
-
 Iran, Islamic republic
-
 Iraq
Iraq
-
 Ireland
-
 Israel
-
 Italy
Italy
-
 Jamaica
-
 Japan
Japan
-
 Jordan
-
 Kazakhstan
-
 Kenya
Kenya
-
 Korea
Korea
-
 Kuwait
-
 Kyrgyzstan
-
 Laos
Laos
-
 Latvia
-
 Lebanon
-
 Lesotho
-
 Libya
Libya
-
 Lithuania
-
 Luxembourg
-
 Madagascar
-
 Malaysia
-
 Malta
Malta
-
 Mauritius
-
 Mexico
-
 Moldova
-
 Mongolia
-
 Montenegro
-
 Morocco
-
 Mozambique
-
 Myanmar
-
 Namibia
-
 Nepal
Nepal
-
 Netherlands
-
 New Zealand
-
 Nigeria
-
 North Macedonia
-
 Norway
-
 Oman
Oman
-
 Pakistan
-
 Palestine
-
 Panama
-
 Papua New Guinea
-
 Paraguay
-
 Peru
Peru
-
 Philippines
-
 Poland
-
 Portugal
-
 Puerto Rico
-
 Qatar
Qatar
-
 Reunion
-
 Romania
-
 Rwanda
-
 Saudi Arabia
-
 Serbia
-
 Singapore
-
 Slovakia
-
 Slovenia
-
 Somalia
-
 South Africa
-
 Spain
Spain
-
 Sri Lanka
-
 Sweden
-
 Switzerland
-
 Syria
Syria
-
 Taiwan
-
 Tajikistan
-
 Tanzania
-
 Thailand
-
 Trinidad and Tobago
-
 Tunisia
-
 Turkey
-
 UAE
UAE
-
 Uganda
-
 Ukraine
-
 United Kingdom
-
United States
-
 Uruguay
-
 Uzbekistan
-
 Venezuela
-
 Vietnam
-
 Yemen
Yemen
-
 Zambia
-
 Zimbabwe
- Forex
- Crypto












