
GRT edges higher with MACD showing strong sell signal: weekly forecast

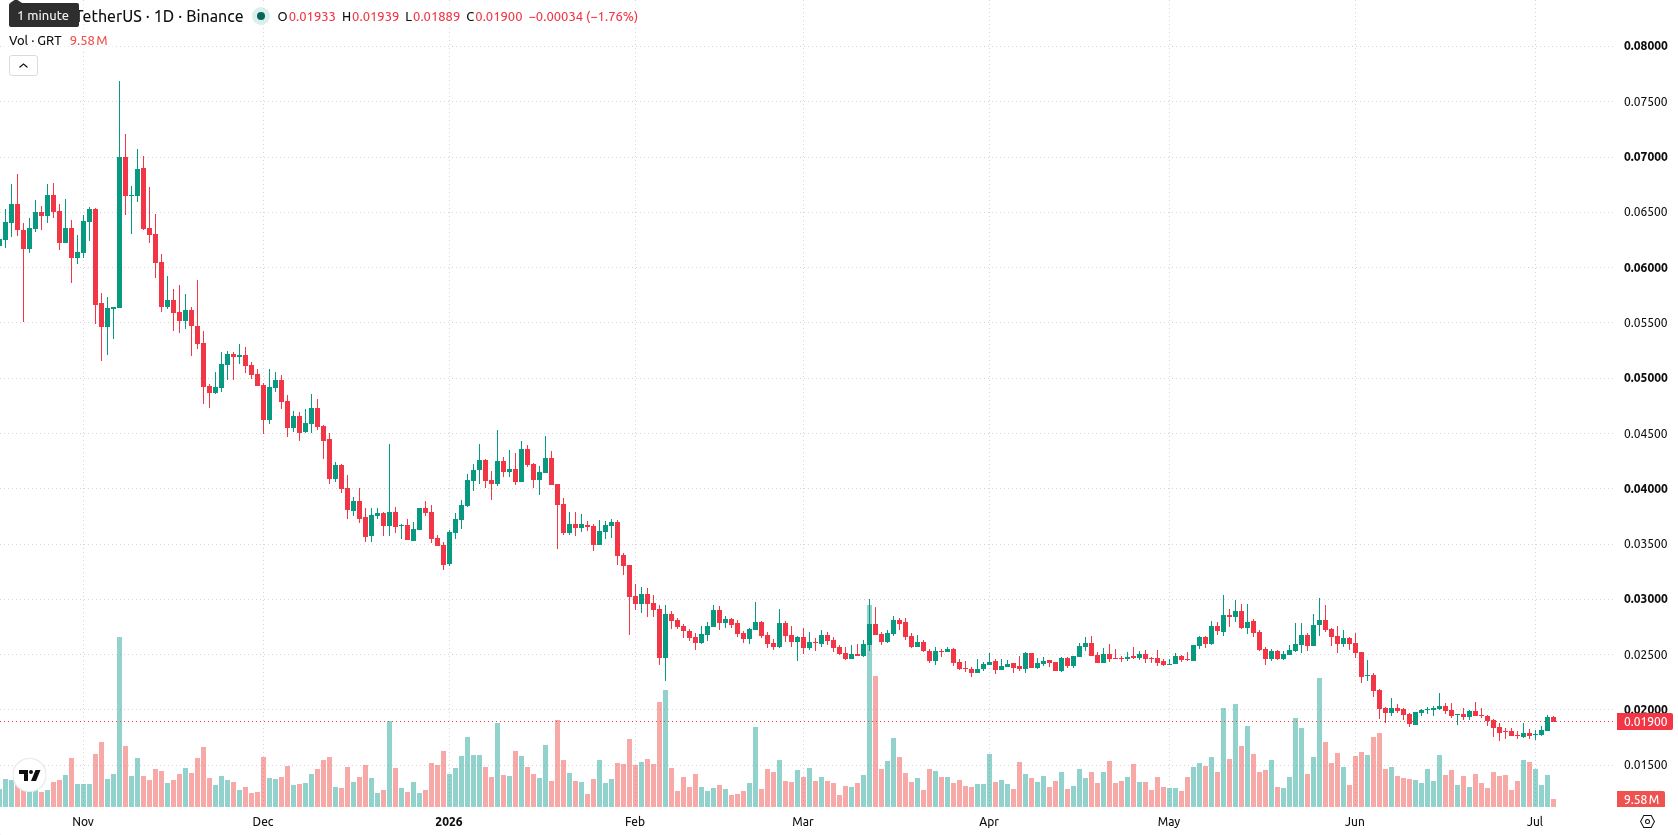
The Graph (GRT) is trading at $0.01901 after rising by $0.0011, or 6.20%, over the past week. Despite this rebound, the asset remains below its key weekly moving averages — MA-20 at $0.02372, MA-50 at $0.04766, and MA-200 at $0.12645 — signaling it is still under persistent downside pressure.
Highlights
- GRT maintains a sustained downtrend, trading below its key moving averages and facing strong dynamic resistance overhead.
- Momentum indicators signal a bearish environment, though oversold oscillators hint at possible short-term stabilization within current levels.
- Price is likely to range between $0.01660 and $0.02140 over the next week, with further declines more probable unless a decisive breakout occurs.
Bearish momentum persists over the week as oversold signals build
Weekly technical signals for GRT are predominantly bearish, with the asset positioned below the MA-20, MA-50, and MA-200, highlighting persistent selling strength. The MACD continues to print a strong sell, and the ADX confirms the prevailing downtrend. Oscillators such as the RSI (30.85) and CCI (-159.48) indicate oversold conditions, while Stochastic RSI points to a possible rebound. Bull/Bear Power remains negative, reinforcing seller dominance, as weekly volatility holds at 12.87%.
Sideways trade likely next week as rally odds remain subdued
Looking ahead to the next 7 days, GRT is expected to trade within a $0.01660 to $0.02140 range, reflecting current volatility levels centered around its price. With none of the major weekly indicators validating a buy signal, there is less than a 20% probability for a sustained rally, implying a baseline scenario of continued sideways price action within this band. Should GRT break above $0.02140, the MA-20 may be tested as dynamic resistance. A move below $0.01660 could accelerate downside momentum, leading to new local lows.
Earlier, analysts noted that The Graph was experiencing persistent bearish momentum with little indication of a near-term reversal. The current analysis reaffirms this outlook, but traders should monitor for any decisive move beyond the $0.02140 resistance or below $0.01660 support, as either could signal a shift in short-term price direction.


-
 Afghanistan
-
 Albania
-
 Algeria
-
 Angola
-
 Argentina
-
 Armenia
-
 Australia
-
 Austria
-
 Azerbaijan
-
 Bahamas
-
 Bahrain
-
 Bangladesh
-
 Belarus
-
 Belgium
-
 Bolivia
-
 Botswana
-
 Brazil
-
 Brunei
-
 Bulgaria
-
 Cambodia
-
 Cameroon
-
 Canada
-
 Chile
Chile
-
 China
China
-
 Colombia
-
 Congo
Congo
-
 Costa Rica
-
 Cote d'Ivoire
-
 Croatia
-
 Cuba
Cuba
-
 Cyprus
-
 Czechia
-
 DR Congo
-
 Denmark
-
 Dominican Republic
-
 Ecuador
-
 Egypt
Egypt
-
 El Salvador
-
 Estonia
-
 Eswatini
-
 Ethiopia
-
 Finland
-
 France
-
 Georgia
-
 Germany
-
 Ghana
Ghana
-
 Greece
-
 Haiti
Haiti
-
 Hong Kong
-
 Hungary
-
 India
India
-
 Indonesia
-
 Iran, Islamic republic
-
 Iraq
Iraq
-
 Ireland
-
 Israel
-
 Italy
Italy
-
 Jamaica
-
 Japan
Japan
-
 Jordan
-
 Kazakhstan
-
 Kenya
Kenya
-
 Korea
Korea
-
 Kuwait
-
 Kyrgyzstan
-
 Laos
Laos
-
 Latvia
-
 Lebanon
-
 Lesotho
-
 Libya
Libya
-
 Lithuania
-
 Luxembourg
-
 Madagascar
-
 Malaysia
-
 Malta
Malta
-
 Mauritius
-
 Mexico
-
 Moldova
-
 Mongolia
-
 Montenegro
-
 Morocco
-
 Mozambique
-
 Myanmar
-
 Namibia
-
 Nepal
Nepal
-
 Netherlands
-
 New Zealand
-
 Nigeria
-
 North Macedonia
-
 Norway
-
 Oman
Oman
-
 Pakistan
-
 Palestine
-
 Panama
-
 Papua New Guinea
-
 Paraguay
-
 Peru
Peru
-
 Philippines
-
 Poland
-
 Portugal
-
 Puerto Rico
-
 Qatar
Qatar
-
 Reunion
-
 Romania
-
 Rwanda
-
 Saudi Arabia
-
 Serbia
-
 Singapore
-
 Slovakia
-
 Slovenia
-
 Somalia
-
 South Africa
-
 Spain
Spain
-
 Sri Lanka
-
 Sweden
-
 Switzerland
-
 Syria
Syria
-
 Taiwan
-
 Tajikistan
-
 Tanzania
-
 Thailand
-
 Trinidad and Tobago
-
 Tunisia
-
 Turkey
-
 UAE
UAE
-
 Uganda
-
 Ukraine
-
 United Kingdom
-
United States
-
 Uruguay
-
 Uzbekistan
-
 Venezuela
-
 Vietnam
-
 Yemen
Yemen
-
 Zambia
-
 Zimbabwe
- Forex
- Crypto
