
Jito technical analysis: Sustained rally above key averages drives upside

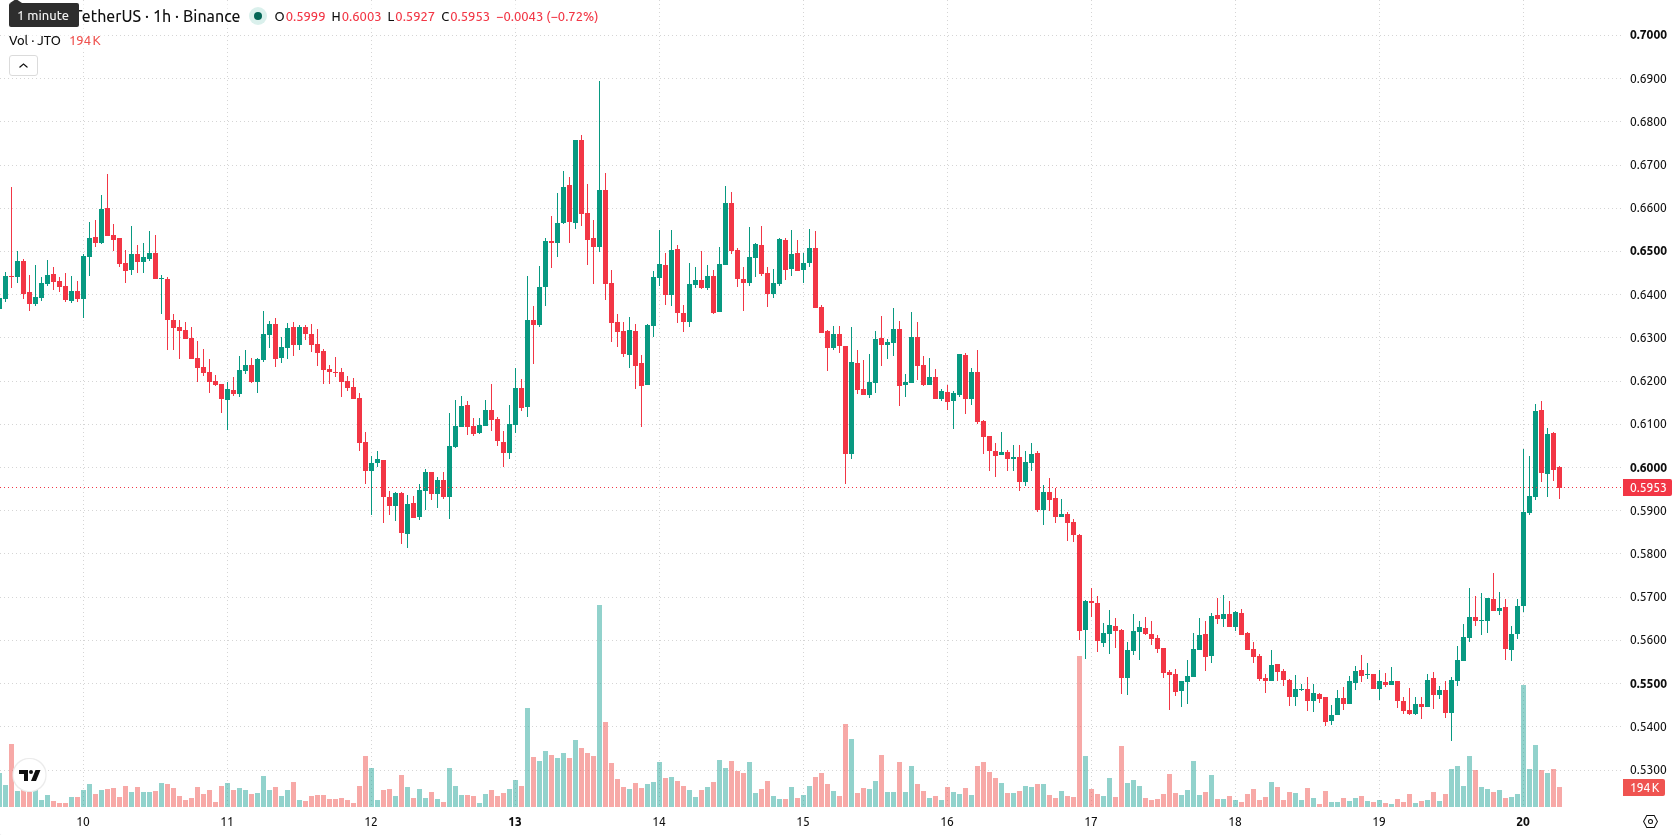
Jito (JTO) is trading at $0.5947 after a robust daily gain of 9.18%. The asset sits above its key short- and medium-term moving averages, continuing its strong momentum as it holds above critical trend levels.
 0.6252
0.6550
0.6252
0.6550
Highlights
- JTO/USD shows strong bullish momentum across short-, medium-, and long-term trends, supported by price trading above key moving averages.
- Technical indicators overwhelmingly signal a buy, though some oscillators show mild overbought conditions and divergent signals, suggesting potential for consolidation.
- Expected trading range for the next 2–3 sessions is $0.5659 to $0.6235, with upside probability remaining very high and key support at $0.5759.
Technical divergence emerges as bullish momentum tests key support
On the hourly chart, JTO/USD trades above the MA-20 and MA-50, highlighting continued strength in the short- and medium-term price structure. The daily Ichimoku Kijun at $0.5759 serves as immediate support, marking a key zone for any pullbacks. Indicator readings present a mixed picture: the Moving Average Convergence Divergence (MACD) and Average Directional Index (ADX) remain aligned with a buy signal, while the Relative Strength Index (RSI) is at 63.96, consistent with a bullish—but not overbought—environment. Stochastic RSI registers as neutral, whereas the Commodity Channel Index (CCI) is in overbought territory, introducing some divergence across oscillators. Bull/Bear Power shows buyers in control of intraday momentum, with the Awesome Oscillator also supporting the current uptrend.
Consolidation likely as upside potential outweighs limited downside risk
Looking ahead, the typical volatility band for JTO/USD in the next two to three sessions is expected between $0.5659 and $0.6235. The probability for further upward movement remains very high, with downside risks appearing minimal. The base case scenario is for price action to consolidate sideways within this range. In bullish conditions, the pair could test the upper boundary on a break above resistance, while a bearish move would require a sustained drop below immediate support, potentially increasing risk toward the lower band.
Earlier, analysts noted that Jito was facing persistent bearish momentum with limited prospects for a near-term rebound. The recent shift to sustained strength above key moving averages, supported by a bullish bias among several indicators, highlights a significant change in trend, making the $0.5759 level a crucial area to watch for potential pullbacks or continued upside.








-
 Afghanistan
-
 Albania
-
 Algeria
-
 Angola
-
 Argentina
-
 Armenia
-
 Australia
-
 Austria
-
 Azerbaijan
-
 Bahamas
-
 Bahrain
-
 Bangladesh
-
 Belarus
-
 Belgium
-
 Bolivia
-
 Botswana
-
 Brazil
-
 Brunei
-
 Bulgaria
-
 Cambodia
-
 Cameroon
-
 Canada
-
 Chile
Chile
-
 China
China
-
 Colombia
-
 Congo
Congo
-
 Costa Rica
-
 Cote d'Ivoire
-
 Croatia
-
 Cuba
Cuba
-
 Cyprus
-
 Czechia
-
 DR Congo
-
 Denmark
-
 Dominican Republic
-
 Ecuador
-
 Egypt
Egypt
-
 El Salvador
-
 Estonia
-
 Eswatini
-
 Ethiopia
-
 Finland
-
 France
-
 Georgia
-
 Germany
-
 Ghana
Ghana
-
 Greece
-
 Haiti
Haiti
-
 Hong Kong
-
 Hungary
-
 India
India
-
 Indonesia
-
 Iran, Islamic republic
-
 Iraq
Iraq
-
 Ireland
-
 Israel
-
 Italy
Italy
-
 Jamaica
-
 Japan
Japan
-
 Jordan
-
 Kazakhstan
-
 Kenya
Kenya
-
 Korea
Korea
-
 Kuwait
-
 Kyrgyzstan
-
 Laos
Laos
-
 Latvia
-
 Lebanon
-
 Lesotho
-
 Libya
Libya
-
 Lithuania
-
 Luxembourg
-
 Madagascar
-
 Malaysia
-
 Malta
Malta
-
 Mauritius
-
 Mexico
-
 Moldova
-
 Mongolia
-
 Montenegro
-
 Morocco
-
 Mozambique
-
 Myanmar
-
 Namibia
-
 Nepal
Nepal
-
 Netherlands
-
 New Zealand
-
 Nigeria
-
 North Macedonia
-
 Norway
-
 Oman
Oman
-
 Pakistan
-
 Palestine
-
 Panama
-
 Papua New Guinea
-
 Paraguay
-
 Peru
Peru
-
 Philippines
-
 Poland
-
 Portugal
-
 Puerto Rico
-
 Qatar
Qatar
-
 Reunion
-
 Romania
-
 Rwanda
-
 Saudi Arabia
-
 Serbia
-
 Singapore
-
 Slovakia
-
 Slovenia
-
 Somalia
-
 South Africa
-
 Spain
Spain
-
 Sri Lanka
-
 Sweden
-
 Switzerland
-
 Syria
Syria
-
 Taiwan
-
 Tajikistan
-
 Tanzania
-
 Thailand
-
 Trinidad and Tobago
-
 Tunisia
-
 Turkey
-
 UAE
UAE
-
 Uganda
-
 Ukraine
-
 United Kingdom
-
United States
-
 Uruguay
-
 Uzbekistan
-
 Venezuela
-
 Vietnam
-
 Yemen
Yemen
-
 Zambia
-
 Zimbabwe
- Forex
- Crypto












