
SOL ticks up as bearish momentum persists on MACD indicator: weekly review

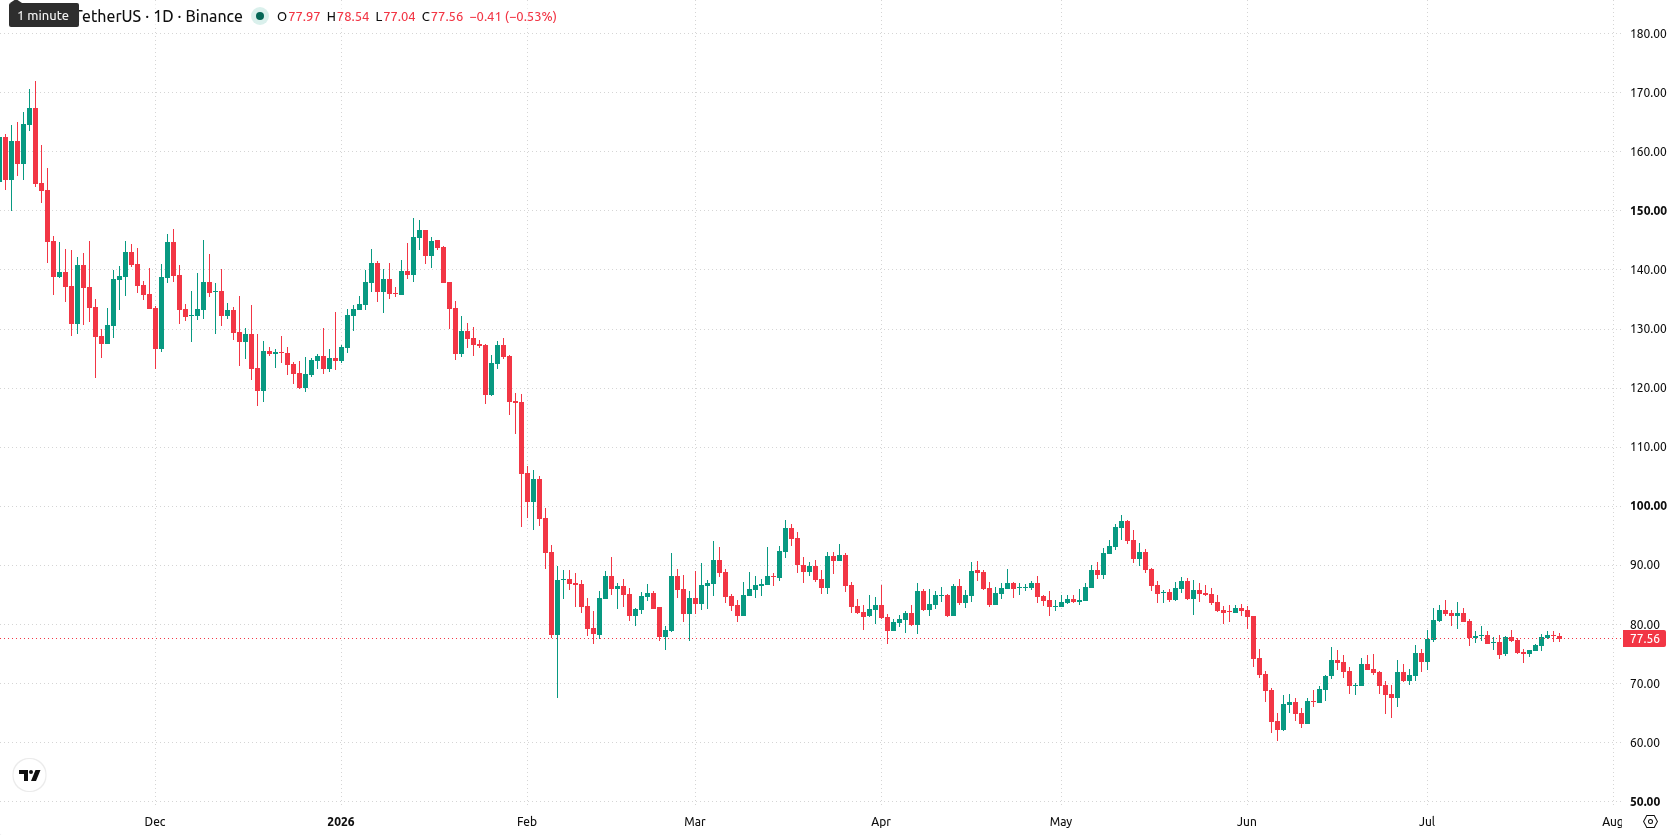
Solana (SOL) is trading at $77.43, having gained $1.25 or 1.71% over the past week. The price remains below key weekly moving averages — MA-20 at $81.06, MA-50 at $124.88, and MA-200 at $107.79 — signaling continued medium- and long-term selling pressure.
 74.29
78.85
74.29
78.85
Highlights
- SOL remains under medium- and long-term selling pressure, trading below key moving averages and resistance levels.
- Bearish momentum persists as technical indicators collectively signal downside risk, outweighing a recent short-lived price uptick.
- SOL is expected to consolidate within the $73.60 to $83.20 range over the next week, with a breakout less than 20% likely.
ETF inflows and staking initiatives drive renewed institutional interest this week
Spot Solana ETFs saw significant institutional demand, as evidenced by a $5.83 million net inflow on July 21 and total ETF assets reaching about $912 million. Morgan Stanley filed final SEC paperwork for Solana and Ethereum staking ETFs, which will hold the coins and distribute staking rewards to shareholders. Additional milestones included Solana processing over 9.8 billion transactions in a recent quarter and a record of 427 million SOL staked, supported by ongoing upgrades and new proposals aimed at improving network speed and reducing token issuance.
Bearish momentum persists as major averages and indicators resist recovery
On the weekly chart, SOL remains below all major moving averages, with MA-20 posing immediate resistance at $81.06 and the Ichimoku Kijun far above at $94.24. Weekly support is found at $73.60, while resistance sits at $83.20. Weekly RSI is in the Sell area and the Stochastic RSI signals Overbought, reflecting potential for mean reversion and caution on upside attempts. MACD and ADX both indicate persistent bearish momentum, while CCI is Neutral and Bull/Bear Power remains Oversold, suggesting the path of least resistance is still to the downside.
Downward bias expected as weak signals limit breakout potential next week
Over the next 7 days, SOL is likely to trade within a corridor of $73.60 to $83.20, based on recent weekly volatility. Given the lack of bullish momentum in all four major indicators, the baseline scenario favors horizontal movement or a downward drift inside this range. Upside breakout above $83.20 is unlikely, with less than a 20% probability according to current signals; downside pressure would resume if SOL breaks below $73.60. A period of consolidation is expected while overall momentum signals remain negative.
Earlier, analysts noted that Solana remained vulnerable to downside moves amid weak momentum and a continued reliance on broader crypto market trends. The latest signals of institutional demand via ETF inflows add an important long-term dimension, but with all major indicators still negative, the prevailing scenario favors near-term consolidation and heightened sensitivity to further changes in sentiment.


Latest Solana News






-
 Afghanistan
-
 Albania
-
 Algeria
-
 Angola
-
 Argentina
-
 Armenia
-
 Australia
-
 Austria
-
 Azerbaijan
-
 Bahamas
-
 Bahrain
-
 Bangladesh
-
 Belarus
-
 Belgium
-
 Bolivia
-
 Botswana
-
 Brazil
-
 Brunei
-
 Bulgaria
-
 Cambodia
-
 Cameroon
-
 Canada
-
 Chile
Chile
-
 China
China
-
 Colombia
-
 Congo
Congo
-
 Costa Rica
-
 Cote d'Ivoire
-
 Croatia
-
 Cuba
Cuba
-
 Cyprus
-
 Czechia
-
 DR Congo
-
 Denmark
-
 Dominican Republic
-
 Ecuador
-
 Egypt
Egypt
-
 El Salvador
-
 Estonia
-
 Eswatini
-
 Ethiopia
-
 Finland
-
 France
-
 Georgia
-
 Germany
-
 Ghana
Ghana
-
 Greece
-
 Haiti
Haiti
-
 Hong Kong
-
 Hungary
-
 India
India
-
 Indonesia
-
 Iran, Islamic republic
-
 Iraq
Iraq
-
 Ireland
-
 Israel
-
 Italy
Italy
-
 Jamaica
-
 Japan
Japan
-
 Jordan
-
 Kazakhstan
-
 Kenya
Kenya
-
 Korea
Korea
-
 Kuwait
-
 Kyrgyzstan
-
 Laos
Laos
-
 Latvia
-
 Lebanon
-
 Lesotho
-
 Libya
Libya
-
 Lithuania
-
 Luxembourg
-
 Madagascar
-
 Malaysia
-
 Malta
Malta
-
 Mauritius
-
 Mexico
-
 Moldova
-
 Mongolia
-
 Montenegro
-
 Morocco
-
 Mozambique
-
 Myanmar
-
 Namibia
-
 Nepal
Nepal
-
 Netherlands
-
 New Zealand
-
 Nigeria
-
 North Macedonia
-
 Norway
-
 Oman
Oman
-
 Pakistan
-
 Palestine
-
 Panama
-
 Papua New Guinea
-
 Paraguay
-
 Peru
Peru
-
 Philippines
-
 Poland
-
 Portugal
-
 Puerto Rico
-
 Qatar
Qatar
-
 Reunion
-
 Romania
-
 Rwanda
-
 Saudi Arabia
-
 Serbia
-
 Singapore
-
 Slovakia
-
 Slovenia
-
 Somalia
-
 South Africa
-
 Spain
Spain
-
 Sri Lanka
-
 Sweden
-
 Switzerland
-
 Syria
Syria
-
 Taiwan
-
 Tajikistan
-
 Tanzania
-
 Thailand
-
 Trinidad and Tobago
-
 Tunisia
-
 Turkey
-
 UAE
UAE
-
 Uganda
-
 Ukraine
-
 United Kingdom
-
United States
-
 Uruguay
-
 Uzbekistan
-
 Venezuela
-
 Vietnam
-
 Yemen
Yemen
-
 Zambia
-
 Zimbabwe
- Forex
- Crypto












