


Flow (FLOW) surged 11.83% today as strong technical momentum after the open drove buyers to dominate intraday action. The rebound remains limited, with the token trading above only its short-term moving average while staying below its 50- and 200-day averages.
 0.038
0.0385
0.038
0.0385
Highlights
- FLOW/USD shows short-term bullish momentum after an 11.83% intraday rally and upside opening gap.
- Mixed technical signals, including overbought oscillators and weak trend conviction, indicate heightened risk of near-term volatility.
- Key trading range for the next five days is $0.0249 to $0.0285, with sideways consolidation likely unless a breakout occurs.
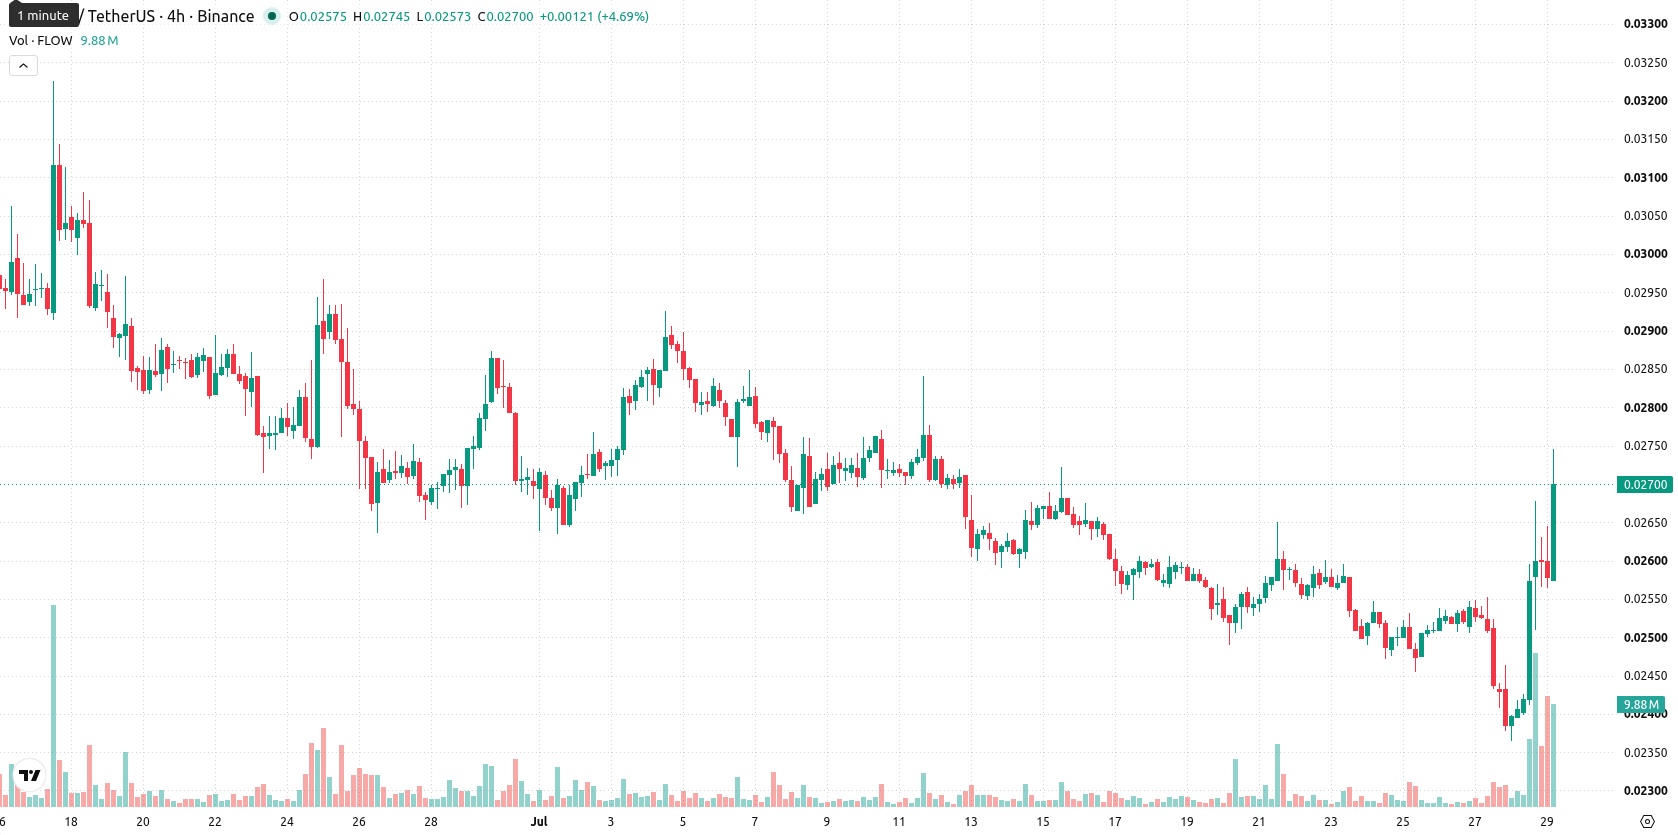
Short-term bullish bias faces weak conviction as oscillators signal overextension
FLOW/USD is trading above the 20-day moving average at $0.0259 but below both the 50-day at $0.0273 and the 200-day at $0.0389, highlighting short-term optimism amid medium- and long-term bearish pressure. The Ichimoku Kijun at $0.0265 serves as a nearby support, with the nearest ceiling at $0.0273 and floor at $0.0268. Momentum signals are mixed: the MACD signals "Strong Sell" and the Average Directional Index (ADX) reads neutral, so trend conviction is weak. The Relative Strength Index (RSI) is neutral at 48.33, but the Stochastic RSI is at 100 with an "Overbought" call, and the Commodity Channel Index (CCI) is also neutral. Bull/Bear Power (BBP) reads above zero, indicating buyers are dominating intraday action, with the overbought status confirmed by Stochastic RSI. The pair advanced $0.0028 or 11.83% today, opening with an upside gap of about $0.002 (8.33%) and is now trading near its daily high, with intraday volatility at 7.42%. This suggests strong upward momentum after the open, even as oscillators flag some risk of overextension.
Earlier, analysts noted that Flow was exhibiting strong short-term bullish momentum while cautioning that sustained upside could be limited by overbought signals and longer-term resistance. The current technical picture adds nuance, suggesting that while intraday buyers remain in control, the lack of conviction across major trend indicators means the next decisive move may hinge on a confirmed breakout above—or breakdown below—the immediate $0.0273/$0.0249 band.










-
 Afghanistan
-
 Albania
-
 Algeria
-
 Angola
-
 Argentina
-
 Armenia
-
 Australia
-
 Austria
-
 Azerbaijan
-
 Bahamas
-
 Bahrain
-
 Bangladesh
-
 Belarus
-
 Belgium
-
 Bolivia
-
 Botswana
-
 Brazil
-
 Brunei
-
 Bulgaria
-
 Cambodia
-
 Cameroon
-
 Canada
-
 Chile
Chile
-
 China
China
-
 Colombia
-
 Congo
Congo
-
 Costa Rica
-
 Cote d'Ivoire
-
 Croatia
-
 Cuba
Cuba
-
 Cyprus
-
 Czechia
-
 DR Congo
-
 Denmark
-
 Dominican Republic
-
 Ecuador
-
 Egypt
Egypt
-
 El Salvador
-
 Estonia
-
 Eswatini
-
 Ethiopia
-
 Finland
-
 France
-
 Georgia
-
 Germany
-
 Ghana
Ghana
-
 Greece
-
 Haiti
Haiti
-
 Hong Kong
-
 Hungary
-
 India
India
-
 Indonesia
-
 Iran, Islamic republic
-
 Iraq
Iraq
-
 Ireland
-
 Israel
-
 Italy
Italy
-
 Jamaica
-
 Japan
Japan
-
 Jordan
-
 Kazakhstan
-
 Kenya
Kenya
-
 Korea
Korea
-
 Kuwait
-
 Kyrgyzstan
-
 Laos
Laos
-
 Latvia
-
 Lebanon
-
 Lesotho
-
 Libya
Libya
-
 Lithuania
-
 Luxembourg
-
 Madagascar
-
 Malaysia
-
 Malta
Malta
-
 Mauritius
-
 Mexico
-
 Moldova
-
 Mongolia
-
 Montenegro
-
 Morocco
-
 Mozambique
-
 Myanmar
-
 Namibia
-
 Nepal
Nepal
-
 Netherlands
-
 New Zealand
-
 Nigeria
-
 North Macedonia
-
 Norway
-
 Oman
Oman
-
 Pakistan
-
 Palestine
-
 Panama
-
 Papua New Guinea
-
 Paraguay
-
 Peru
Peru
-
 Philippines
-
 Poland
-
 Portugal
-
 Puerto Rico
-
 Qatar
Qatar
-
 Reunion
-
 Romania
-
 Rwanda
-
 Saudi Arabia
-
 Serbia
-
 Singapore
-
 Slovakia
-
 Slovenia
-
 Somalia
-
 South Africa
-
 Spain
Spain
-
 Sri Lanka
-
 Sweden
-
 Switzerland
-
 Syria
Syria
-
 Taiwan
-
 Tajikistan
-
 Tanzania
-
 Thailand
-
 Trinidad and Tobago
-
 Tunisia
-
 Turkey
-
 UAE
UAE
-
 Uganda
-
 Ukraine
-
 United Kingdom
-
United States
-
 Uruguay
-
 Uzbekistan
-
 Venezuela
-
 Vietnam
-
 Yemen
Yemen
-
 Zambia
-
 Zimbabwe
- Forex
- Crypto












