

Pepe decline stretches into oversold territory as regulation headlines provoke caution: weekly outlook

Pepe (PEPE) sits near $0.0000027 after shedding around 3.5% over the past week, as regulatory headlines have pushed sentiment to the cautious side. The recent stretch into technically oversold territory coincides with intensifying focus on official action in the meme token space. With regulation in the spotlight, traders will look for cues on whether institutional flows or further policy chatter set the tone in the days ahead.
 0.0539
0.054330
0.0539
0.054330
Highlights
- Pepe continues to exhibit long-term bearish momentum, trading below all major moving averages and near weekly lows.
- Technical signals are mixed, with oversold oscillators suggesting potential for a short-lived bounce despite prevailing downward pressure.
- Rangebound action is expected between $0.000002461 and $0.000002938 next week, with strong resistance at $0.00000272 and a dominant probability of further decline.
ETF filing and whale accumulation drive institutional hopes this week
Canary Capital filed an S-1 registration with the U.S. SEC in April 2026 to list the first spot ETF tracking PEPE, according to multiple press releases published by openPR.com within the past week. If approved, the ETF would mark a significant step toward institutional adoption of meme tokens, increasing the regulatory visibility of PEPE. Large holders have also accumulated approximately $7.5 million in PEPE near the $0.0000027 support zone, as reported by CoinMarketCap.
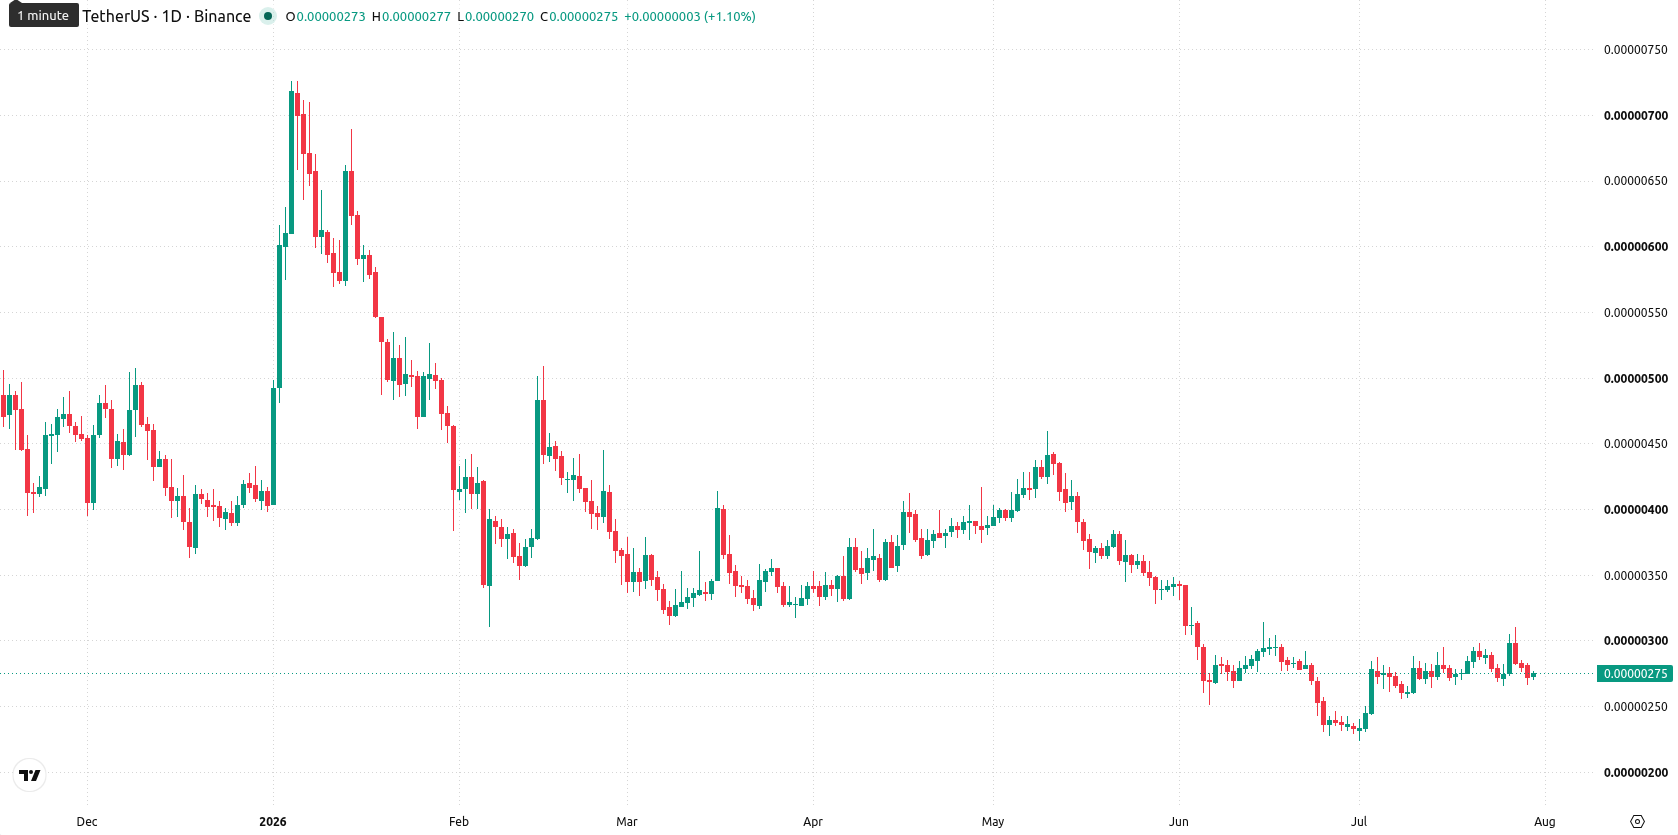
Volatile week as technical signals diverge and buyers test oversold zone
On the daily chart, a sharp move lower without a sustained trend characterizes price action, with volatility at 16.98%. Momentum signals are mixed: the MACD points to a strong buy while the Stochastic RSI sits deep in the oversold zone at 1.31, suggesting potential for a short-term bounce, though the HMA remains in sell territory. Immediate support is set at $0.00000265, with resistance just above at the MA-50 level of $0.00000272, while the Ichimoku Kijun at $0.000002825 continues to cap further gains.
Consolidation outlook as breakout risk hinges on support and resistance
Next week, Pepe is expected to move within a range of $0.000002461 to $0.000002938, with a 29% probability of an increase and a 71% chance of a decrease. The base case sees price consolidating below resistance, largely contained by the $0.00000272 and $0.00000265 levels. A push above $0.00000272 could trigger upside toward $0.000002825, while a break under $0.00000265 would likely confirm further losses toward the bottom of the forecast range.
Earlier, analysts noted that persistent seller momentum and weak technical signals had placed Pepe in a bearish posture. Against this backdrop, the new regulatory developments and increased large-holder accumulation introduce the possibility of a shift, making the $0.00000272 resistance a key level for traders to watch in the near term.










-
 Afghanistan
-
 Albania
-
 Algeria
-
 Angola
-
 Argentina
-
 Armenia
-
 Australia
-
 Austria
-
 Azerbaijan
-
 Bahamas
-
 Bahrain
-
 Bangladesh
-
 Belarus
-
 Belgium
-
 Bolivia
-
 Botswana
-
 Brazil
-
 Brunei
-
 Bulgaria
-
 Cambodia
-
 Cameroon
-
 Canada
-
 Chile
Chile
-
 China
China
-
 Colombia
-
 Congo
Congo
-
 Costa Rica
-
 Cote d'Ivoire
-
 Croatia
-
 Cuba
Cuba
-
 Cyprus
-
 Czechia
-
 DR Congo
-
 Denmark
-
 Dominican Republic
-
 Ecuador
-
 Egypt
Egypt
-
 El Salvador
-
 Estonia
-
 Eswatini
-
 Ethiopia
-
 Finland
-
 France
-
 Georgia
-
 Germany
-
 Ghana
Ghana
-
 Greece
-
 Haiti
Haiti
-
 Hong Kong
-
 Hungary
-
 India
India
-
 Indonesia
-
 Iran, Islamic republic
-
 Iraq
Iraq
-
 Ireland
-
 Israel
-
 Italy
Italy
-
 Jamaica
-
 Japan
Japan
-
 Jordan
-
 Kazakhstan
-
 Kenya
Kenya
-
 Korea
Korea
-
 Kuwait
-
 Kyrgyzstan
-
 Laos
Laos
-
 Latvia
-
 Lebanon
-
 Lesotho
-
 Libya
Libya
-
 Lithuania
-
 Luxembourg
-
 Madagascar
-
 Malaysia
-
 Malta
Malta
-
 Mauritius
-
 Mexico
-
 Moldova
-
 Mongolia
-
 Montenegro
-
 Morocco
-
 Mozambique
-
 Myanmar
-
 Namibia
-
 Nepal
Nepal
-
 Netherlands
-
 New Zealand
-
 Nigeria
-
 North Macedonia
-
 Norway
-
 Oman
Oman
-
 Pakistan
-
 Palestine
-
 Panama
-
 Papua New Guinea
-
 Paraguay
-
 Peru
Peru
-
 Philippines
-
 Poland
-
 Portugal
-
 Puerto Rico
-
 Qatar
Qatar
-
 Reunion
-
 Romania
-
 Rwanda
-
 Saudi Arabia
-
 Serbia
-
 Singapore
-
 Slovakia
-
 Slovenia
-
 Somalia
-
 South Africa
-
 Spain
Spain
-
 Sri Lanka
-
 Sweden
-
 Switzerland
-
 Syria
Syria
-
 Taiwan
-
 Tajikistan
-
 Tanzania
-
 Thailand
-
 Trinidad and Tobago
-
 Tunisia
-
 Turkey
-
 UAE
UAE
-
 Uganda
-
 Ukraine
-
 United Kingdom
-
United States
-
 Uruguay
-
 Uzbekistan
-
 Venezuela
-
 Vietnam
-
 Yemen
Yemen
-
 Zambia
-
 Zimbabwe
- Forex
- Crypto












