

Quant weekly forecast: Downside pressure stays high as MACD points to continued bearish momentum

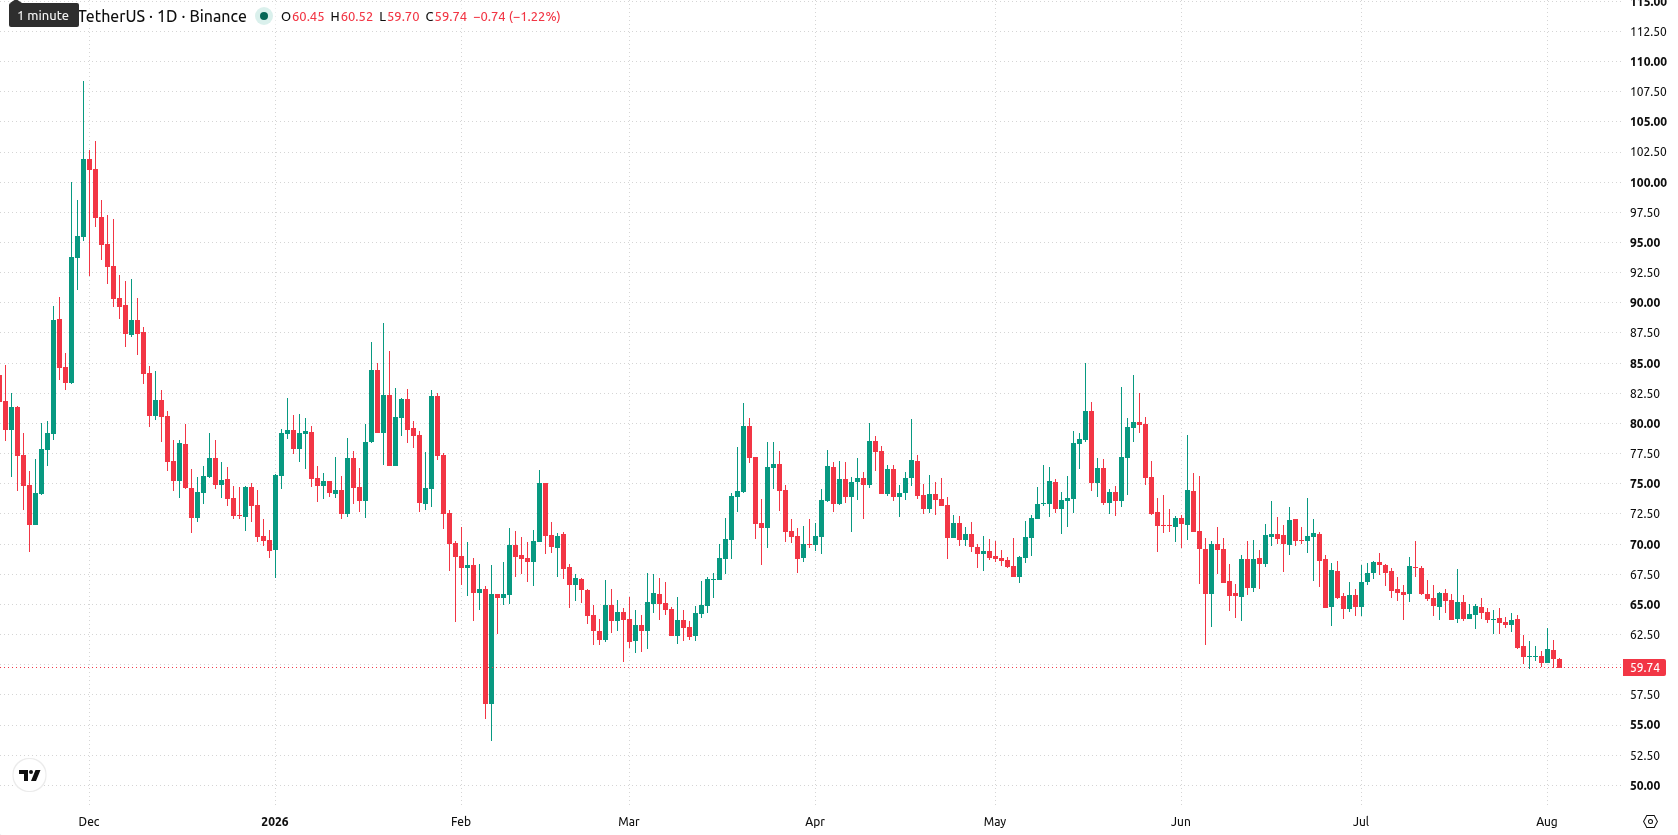
Quant (QNT) is trading around $60 after a decline of nearly 5% over the past week, with a prolonged downtrend bringing support levels into sharper focus. With bearish momentum persisting and no signs of reversal, traders will be watching for potential stabilization or a further stretch to the downside in the days ahead.
 193.7
208.670000
Highlights
- Quant declined 4.56% to $60.01 over the week, ending at the lower boundary of its trading range.
- The token trades well below key moving averages, reflecting a bearish long-term trend amid persistent downside pressure.
- Price is expected to consolidate between $59.64 support and $63 resistance, with a high probability of further downside.
Market cap steady as erc-20 utility supports token participation
According to Markets Daily, as of July 31, 2026, QNT's total market capitalization stood at $722.43 million as it continued to operate as an ERC-20 token, enabling governance participation and payment of network fees across exchanges.
Negative momentum intensifies over week as price holds near support
On the daily chart, the setup remains heavy with price action contained within a narrow range and volatility at 5.63%. Momentum signals lean negative: MACD continues in sell territory, while CCI sits deeply in oversold at -109.210935, but Stochastic RSI holds neutral. Support lies at $59.64 and resistance at $63, with the Kijun at $64.92 posing an additional barrier. These factors suggest a loss of bullish momentum and persistent downside pressure.
Downside bias for next week as breakout risk centers on key levels
In the week ahead, Quant is expected to move between $58.232055 and $61.787944. There is a very low probability (less than 20%) of an increase and a very high probability (more than 80%) of a decrease. The base case calls for consolidation between support at $59.64 and resistance at $63. A push above resistance could target the Kijun at $64.92, while a decline through support would open a move toward the lower end of the projected range.
Earlier, analysts noted that Quant was entrenched in a bearish trend, with technical signals confirming sellers remained in control. The latest market action reinforces this outlook, making sustained downside pressure and vigilance around the $59.64 support level critical for traders monitoring further weakness.











-
 Afghanistan
-
 Albania
-
 Algeria
-
 Angola
-
 Argentina
-
 Armenia
-
 Australia
-
 Austria
-
 Azerbaijan
-
 Bahamas
-
 Bahrain
-
 Bangladesh
-
 Belarus
-
 Belgium
-
 Bolivia
-
 Botswana
-
 Brazil
-
 Brunei
-
 Bulgaria
-
 Cambodia
-
 Cameroon
-
 Canada
-
 Chile
-
 China
-
 Colombia
-
 Congo
-
 Costa Rica
-
 Cote d'Ivoire
-
 Croatia
-
 Cuba
-
 Cyprus
-
 Czechia
-
 DR Congo
-
 Denmark
-
 Dominican Republic
-
 Ecuador
-
 Egypt
-
 El Salvador
-
 Estonia
-
 Eswatini
-
 Ethiopia
-
 Finland
-
 France
-
 Georgia
-
 Germany
-
 Ghana
-
 Greece
-
 Haiti
-
 Hong Kong
-
 Hungary
-
 India
-
 Indonesia
-
 Iran, Islamic republic
-
 Iraq
-
 Ireland
-
 Israel
-
 Italy
-
 Jamaica
-
 Japan
-
 Jordan
-
 Kazakhstan
-
 Kenya
-
 Korea
-
 Kuwait
-
 Kyrgyzstan
-
 Laos
-
 Latvia
-
 Lebanon
-
 Lesotho
-
 Libya
-
 Lithuania
-
 Luxembourg
-
 Madagascar
-
 Malaysia
-
 Malta
-
 Mauritius
-
 Mexico
-
 Moldova
-
 Mongolia
-
 Montenegro
-
 Morocco
-
 Mozambique
-
 Myanmar
-
 Namibia
-
 Nepal
-
 Netherlands
-
 New Zealand
-
 Nigeria
-
 North Macedonia
-
 Norway
-
 Oman
-
 Pakistan
-
 Palestine
-
 Panama
-
 Papua New Guinea
-
 Paraguay
-
 Peru
-
 Philippines
-
 Poland
-
 Portugal
-
 Puerto Rico
-
 Qatar
-
 Reunion
-
 Romania
-
 Rwanda
-
 Saudi Arabia
-
 Serbia
-
 Singapore
-
 Slovakia
-
 Slovenia
-
 Somalia
-
 South Africa
-
 Spain
-
 Sri Lanka
-
 Sweden
-
 Switzerland
-
 Syria
-
 Taiwan
-
 Tajikistan
-
 Tanzania
-
 Thailand
-
 Trinidad and Tobago
-
 Tunisia
-
 Turkey
-
 UAE
-
 Uganda
-
 Ukraine
-
 United Kingdom
-
United States
-
 Uruguay
-
 Uzbekistan
-
 Venezuela
-
 Vietnam
-
 Yemen
-
 Zambia
-
 Zimbabwe
- Forex
- Crypto












