

Why is Movement down today? Key $0.0066 support levels to watch

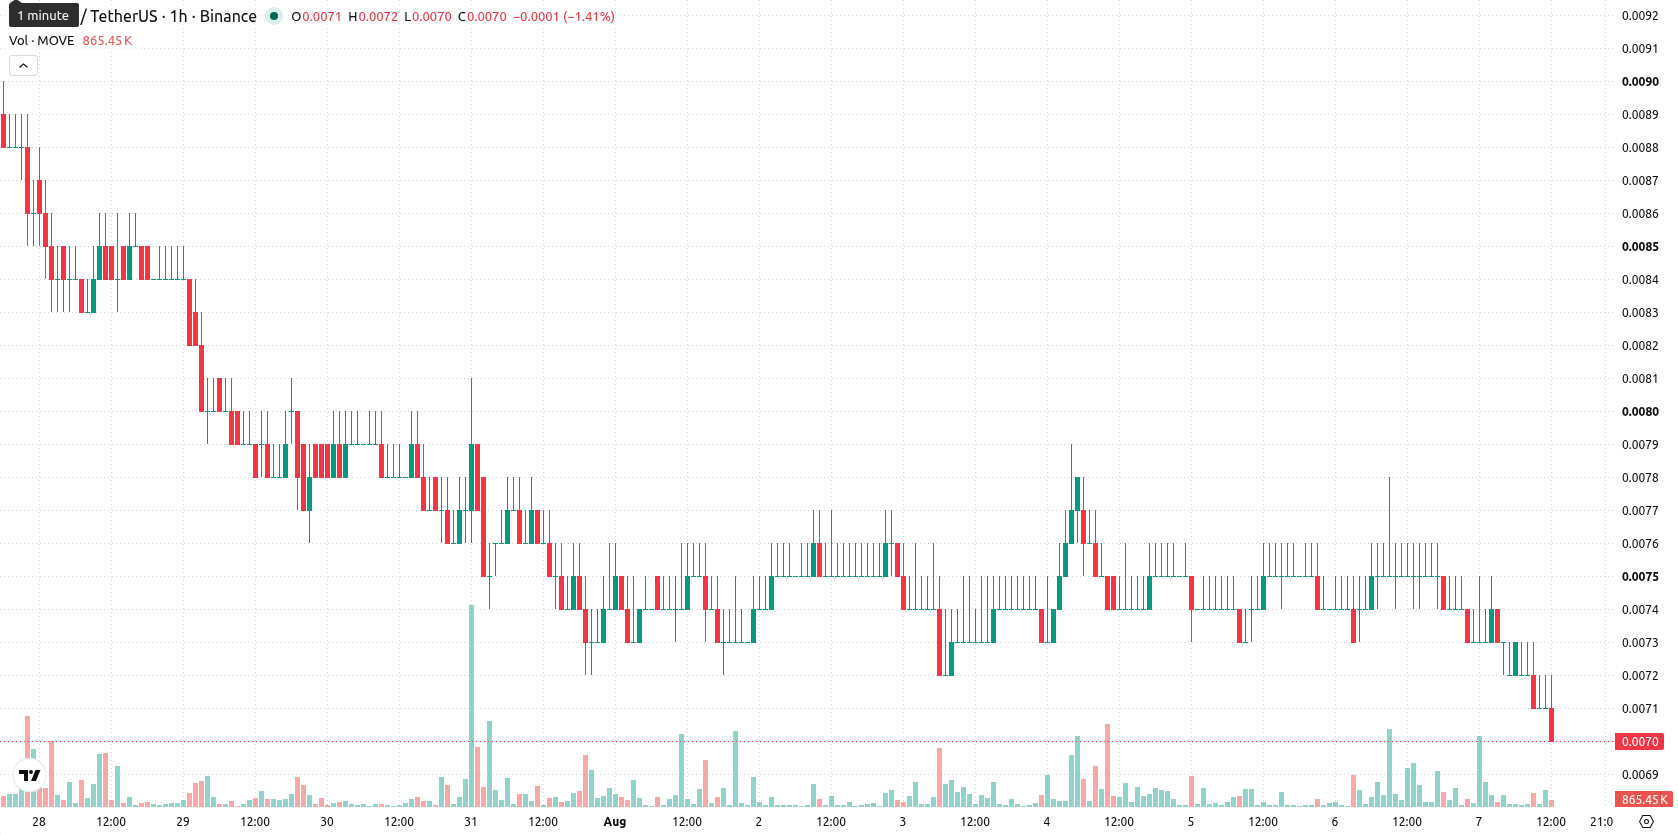
Movement (MOVE) is trading at $0.007, marking a daily decline of 6.67%. The asset remains positioned below its key moving averages, reflecting continued downward momentum within the current session.
 0.0046
0.005068
Highlights
- MOVE/USD remains under heavy selling pressure, trading below key moving averages and near its session lows.
- Momentum indicators such as MACD and the Awesome Oscillator confirm a strong bearish trend with oversold conditions prevailing.
- In the next two to three days, MOVE/USD is expected to consolidate between $0.0066 and $0.0072, with risk skewed to further downside.
Oversold pressures mount as technical resistance caps rebound
MOVE/USD is trading below the MA-20 ($0.0073) and MA-50 ($0.0074) on the hourly chart, as well as under the MA-200 ($0.0177) on the daily timeframe. The Ichimoku Kijun ($0.0074) is acting as immediate resistance. On the indicator front, MACD signals Sell while ADX is Neutral. RSI registers at 29.0159—deep in oversold territory—supported by Stochastic RSI and CCI, both confirming stretched downside momentum. Bull/Bear Power points to intraday seller dominance, and the Awesome Oscillator is consistent with a broader downtrend.
Consolidation expected as upside remains capped by resistance
In the short term, price action is expected to consolidate within the $0.0066 to $0.0072 range over the next two to three trading days. Upside potential remains very limited, with a break above $0.0074 needed to shift sentiment. If prices move below $0.0066, accelerated selling could trigger further downside risk.
Earlier, analysts noted that Movement (MOVE) remained under persistent bearish pressure, with technical signals favoring continued downside. The current analysis reinforces this negative outlook, highlighting the importance of monitoring the $0.0066 level as a potential trigger for renewed selling momentum.










-
 Afghanistan
-
 Albania
-
 Algeria
-
 Angola
-
 Argentina
-
 Armenia
-
 Australia
-
 Austria
-
 Azerbaijan
-
 Bahamas
-
 Bahrain
-
 Bangladesh
-
 Belarus
-
 Belgium
-
 Bolivia
-
 Botswana
-
 Brazil
-
 Brunei
-
 Bulgaria
-
 Cambodia
-
 Cameroon
-
 Canada
-
 Chile
-
 China
-
 Colombia
-
 Congo
-
 Costa Rica
-
 Cote d'Ivoire
-
 Croatia
-
 Cuba
-
 Cyprus
-
 Czechia
-
 DR Congo
-
 Denmark
-
 Dominican Republic
-
 Ecuador
-
 Egypt
-
 El Salvador
-
 Estonia
-
 Eswatini
-
 Ethiopia
-
 Finland
-
 France
-
 Georgia
-
 Germany
-
 Ghana
-
 Greece
-
 Haiti
-
 Hong Kong
-
 Hungary
-
 India
-
 Indonesia
-
 Iran, Islamic republic
-
 Iraq
-
 Ireland
-
 Israel
-
 Italy
-
 Jamaica
-
 Japan
-
 Jordan
-
 Kazakhstan
-
 Kenya
-
 Korea
-
 Kuwait
-
 Kyrgyzstan
-
 Laos
-
 Latvia
-
 Lebanon
-
 Lesotho
-
 Libya
-
 Lithuania
-
 Luxembourg
-
 Madagascar
-
 Malaysia
-
 Malta
-
 Mauritius
-
 Mexico
-
 Moldova
-
 Mongolia
-
 Montenegro
-
 Morocco
-
 Mozambique
-
 Myanmar
-
 Namibia
-
 Nepal
-
 Netherlands
-
 New Zealand
-
 Nigeria
-
 North Macedonia
-
 Norway
-
 Oman
-
 Pakistan
-
 Palestine
-
 Panama
-
 Papua New Guinea
-
 Paraguay
-
 Peru
-
 Philippines
-
 Poland
-
 Portugal
-
 Puerto Rico
-
 Qatar
-
 Reunion
-
 Romania
-
 Rwanda
-
 Saudi Arabia
-
 Serbia
-
 Singapore
-
 Slovakia
-
 Slovenia
-
 Somalia
-
 South Africa
-
 Spain
-
 Sri Lanka
-
 Sweden
-
 Switzerland
-
 Syria
-
 Taiwan
-
 Tajikistan
-
 Tanzania
-
 Thailand
-
 Trinidad and Tobago
-
 Tunisia
-
 Turkey
-
 UAE
-
 Uganda
-
 Ukraine
-
 United Kingdom
-
United States
-
 Uruguay
-
 Uzbekistan
-
 Venezuela
-
 Vietnam
-
 Yemen
-
 Zambia
-
 Zimbabwe
- Forex
- Crypto












