

DOGE weekly outlook: Can resistance at $0.07259 halt the recovery?

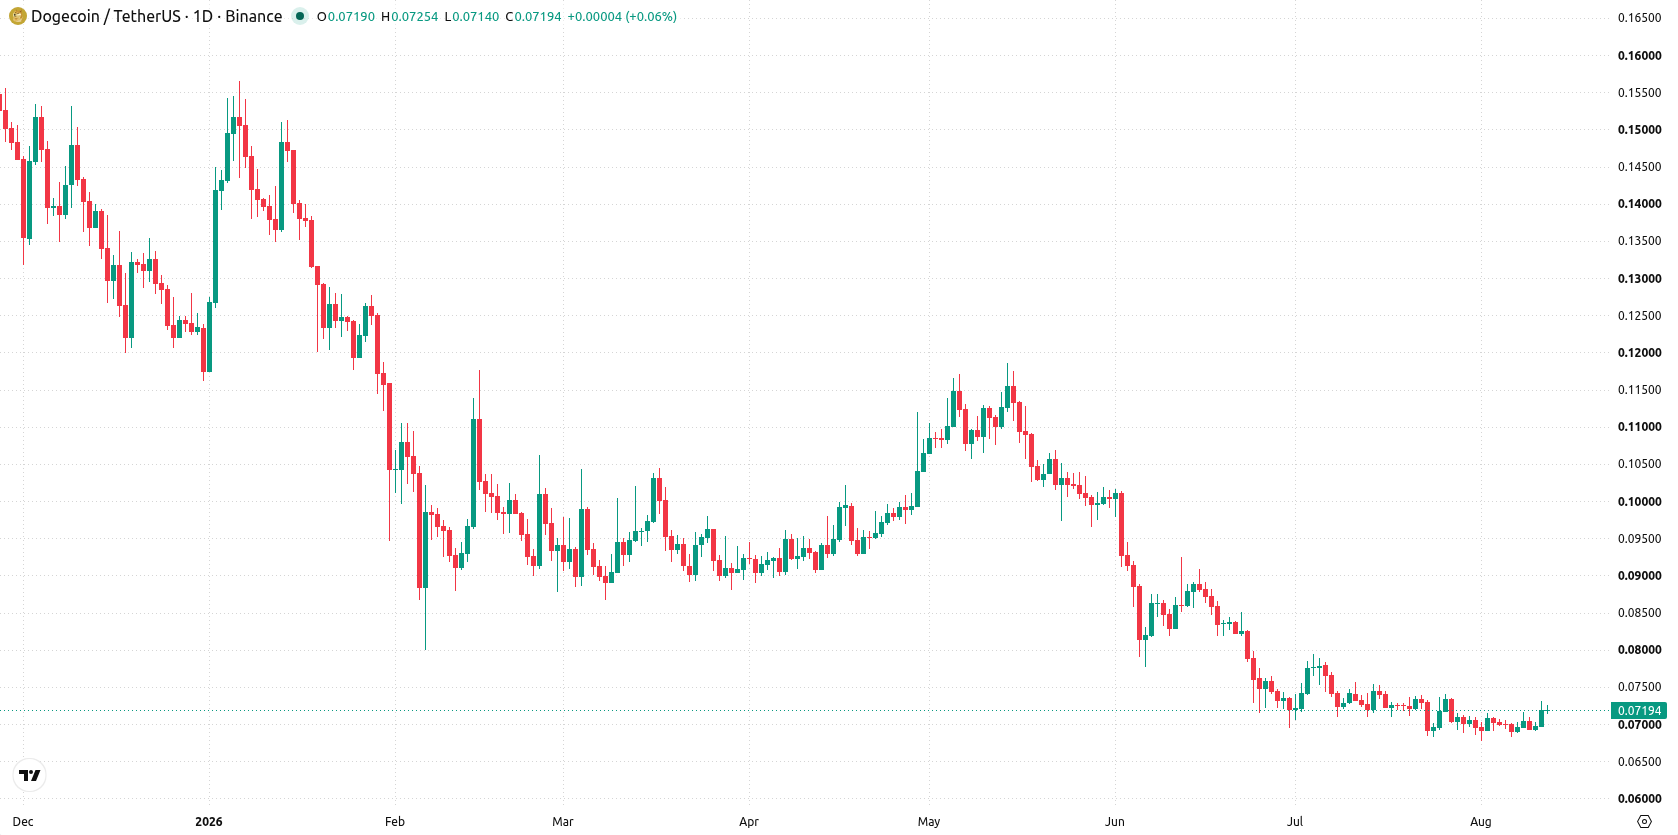
Dogecoin (DOGE) pushed near $0.072 this week, recovering by around 3% as institutional flows shaped sentiment. As ETF activity and renewed fund listings bring increased attention to the asset, a surge in both outflows and network use could set the tone for a volatile stretch ahead.
 0.08814
0.09639
0.08814
0.09639
Highlights
- Dogecoin gained 3.21% over the past 7 days, moving above the short-term average but staying below the long-term trend level.
- Momentum signals are mixed, with bearish indications from some indicators and bullish support from others, suggesting uncertainty in market control.
- DOGE/USD is projected to consolidate between $0.06864 and $0.07462 over the next 7 days, with slightly higher odds of a decrease.
Institutional inclusion and ETF outflows shape mixed sentiment this week
Dogecoin saw a notable institutional milestone as T. Rowe Price added DOGE to its actively managed TKNZ crypto ETF at a 1.26% allocation, according to openPR.com, marking the first time a leading $1.9 trillion asset manager included a memecoin inside a spot crypto fund. Grayscale also converted its Dogecoin Trust into a spot ETF on NYSE Arca under the ticker GDOG, expanding regulated access to the token. At the same time, Coingape.com and openPR.com reported four straight days of ETF outflows and the worst monthly performance since launch in July, while CoinGlass data highlighted a 16% weekly rise in active addresses, signaling greater activity from individual traders.
Divided momentum and resistance tests fuel weekly technical uncertainty
On the daily chart, the trend is trending with a sustained move higher and a firm trend, as volatility reached 7.23%. Momentum signals are divided: MACD signals Strong Sell at -0.00096 while Bull/Bear Power posts a Strong Buy, indicating a split in market dominance. The pair is approaching resistance at the MA-50 ($0.07259), with support at the Ichimoku Kijun ($0.07085) just below. This ongoing tug-of-war suggests that a directional move could quickly reverse if one side gains the upper hand.
Range-bound outlook as directional bias hinges on breakout triggers
Over the next 7 days, DOGE/USD is expected to trade between $0.06864 and $0.07462, with a 48% probability of an increase and a 52% probability of a decrease. The base case sees consolidation within this range, as the market digests recent gains. A bullish scenario would require a decisive move above $0.07259 resistance, targeting the upper end of the projected range. A bearish scenario could develop if the price closes below the $0.07085 support level.
Earlier, analysts noted that broad legislative uncertainty and shifting regulatory debates in Washington had weighed on major cryptocurrencies, including Dogecoin, as market participants awaited clarity. Now, with DOGE attracting attention from institutional funds but exhibiting divergent on-chain and ETF flow signals, traders should monitor for a break out of the $0.06864–$0.07462 consolidation range to establish clearer directional bias.











-
 Afghanistan
-
 Albania
-
 Algeria
-
 Angola
-
 Argentina
-
 Armenia
-
 Australia
-
 Austria
-
 Azerbaijan
-
 Bahamas
-
 Bahrain
-
 Bangladesh
-
 Belarus
-
 Belgium
-
 Bolivia
-
 Botswana
-
 Brazil
-
 Brunei
-
 Bulgaria
-
 Cambodia
-
 Cameroon
-
 Canada
-
 Chile
Chile
-
 China
China
-
 Colombia
-
 Congo
Congo
-
 Costa Rica
-
 Cote d'Ivoire
-
 Croatia
-
 Cuba
Cuba
-
 Cyprus
-
 Czechia
-
 DR Congo
-
 Denmark
-
 Dominican Republic
-
 Ecuador
-
 Egypt
Egypt
-
 El Salvador
-
 Estonia
-
 Eswatini
-
 Ethiopia
-
 Finland
-
 France
-
 Georgia
-
 Germany
-
 Ghana
Ghana
-
 Greece
-
 Haiti
Haiti
-
 Hong Kong
-
 Hungary
-
 India
India
-
 Indonesia
-
 Iran, Islamic republic
-
 Iraq
Iraq
-
 Ireland
-
 Israel
-
 Italy
Italy
-
 Jamaica
-
 Japan
Japan
-
 Jordan
-
 Kazakhstan
-
 Kenya
Kenya
-
 Korea
Korea
-
 Kuwait
-
 Kyrgyzstan
-
 Laos
Laos
-
 Latvia
-
 Lebanon
-
 Lesotho
-
 Libya
Libya
-
 Lithuania
-
 Luxembourg
-
 Madagascar
-
 Malaysia
-
 Malta
Malta
-
 Mauritius
-
 Mexico
-
 Moldova
-
 Mongolia
-
 Montenegro
-
 Morocco
-
 Mozambique
-
 Myanmar
-
 Namibia
-
 Nepal
Nepal
-
 Netherlands
-
 New Zealand
-
 Nigeria
-
 North Macedonia
-
 Norway
-
 Oman
Oman
-
 Pakistan
-
 Palestine
-
 Panama
-
 Papua New Guinea
-
 Paraguay
-
 Peru
Peru
-
 Philippines
-
 Poland
-
 Portugal
-
 Puerto Rico
-
 Qatar
Qatar
-
 Reunion
-
 Romania
-
 Rwanda
-
 Saudi Arabia
-
 Serbia
-
 Singapore
-
 Slovakia
-
 Slovenia
-
 Somalia
-
 South Africa
-
 Spain
Spain
-
 Sri Lanka
-
 Sweden
-
 Switzerland
-
 Syria
Syria
-
 Taiwan
-
 Tajikistan
-
 Tanzania
-
 Thailand
-
 Trinidad and Tobago
-
 Tunisia
-
 Turkey
-
 UAE
UAE
-
 Uganda
-
 Ukraine
-
 United Kingdom
-
United States
-
 Uruguay
-
 Uzbekistan
-
 Venezuela
-
 Vietnam
-
 Yemen
Yemen
-
 Zambia
-
 Zimbabwe
- Forex
- Crypto












