

What's behind Movement's latest 11.3% price surge?

Movement (MOVE) jumped 11.29% in a strong intraday rebound driven by short-term technical momentum and volatile trading conditions. The move remains limited, as MOVE continues to trade below its 20-, 50-, and 200-day moving averages, reinforcing the underlying bearish structure.
 0.0087
0.009866
0.0087
0.009866
Highlights
- MOVE/USD trades below key moving averages, confirming bearish short-, medium-, and long-term trends.
- Momentum indicators are mixed, with most showing weak or oversold conditions and intraday signals unsettled.
- MOVE/USD is expected to range between $0.0056 and $0.0075 over the next five days, with a 79% probability of decline.
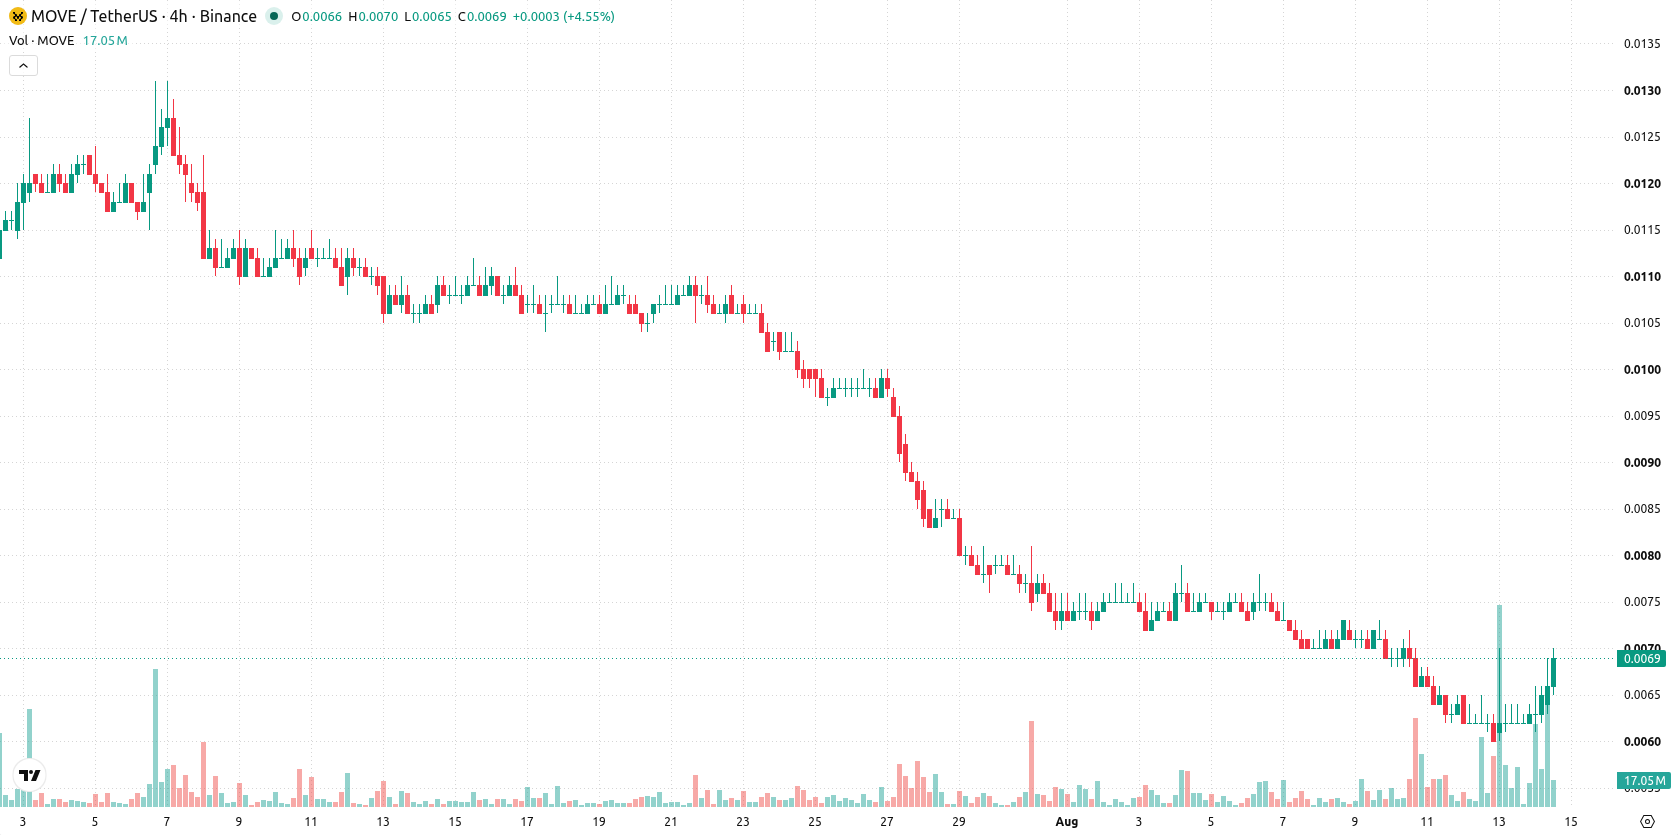
Seller control confirmed as key averages and indicators reinforce bearishness
MOVE/USD remains under pressure, trading below the 20-day, 50-day, and 200-day moving averages ($0.0075, $0.0097, and $0.0167 respectively). This alignment signals that short-, medium-, and long-term trends are tilted in favor of sellers, with the prevailing bearish structure reaffirmed by the negative MA-50 versus MA-200 alignment. Near-term resistance is now at $0.0073, with support at $0.0061. Momentum signals remain weak, with the Moving Average Convergence Divergence (MACD) and Average Directional Index (ADX) both flashing 'Sell'. The Relative Strength Index (RSI) sits deeply oversold at 22.96, but the Stochastic RSI reads overbought, and the Commodity Channel Index (CCI) remains in oversold territory. Bull/Bear Power (BBP) is at 0, indicating no clear dominance by buyers or sellers, with mixed momentum seen intraday. MOVE/USD advanced $0.0007 or 11.29% today, opening with an upside gap of approximately 1.61%. The price is currently near the session high, and intraday volatility stands at 13.11%. The overall tone intraday is one of upward strength toward highs, though momentum indicators highlight uncertain direction.
Earlier, analysts noted that Movement was showing early signs of technical recovery after a period of bearish momentum. The current setup now underscores persistent downside risk despite today’s rebound, making the $0.0061 support level pivotal for assessing whether renewed selling pressure will lead to a retest of lows in the coming days.





Latest Movement News





-
 Afghanistan
-
 Albania
-
 Algeria
-
 Angola
-
 Argentina
-
 Armenia
-
 Australia
-
 Austria
-
 Azerbaijan
-
 Bahamas
-
 Bahrain
-
 Bangladesh
-
 Belarus
-
 Belgium
-
 Bolivia
-
 Botswana
-
 Brazil
-
 Brunei
-
 Bulgaria
-
 Cambodia
-
 Cameroon
-
 Canada
-
 Chile
Chile
-
 China
China
-
 Colombia
-
 Congo
Congo
-
 Costa Rica
-
 Cote d'Ivoire
-
 Croatia
-
 Cuba
Cuba
-
 Cyprus
-
 Czechia
-
 DR Congo
-
 Denmark
-
 Dominican Republic
-
 Ecuador
-
 Egypt
Egypt
-
 El Salvador
-
 Estonia
-
 Eswatini
-
 Ethiopia
-
 Finland
-
 France
-
 Georgia
-
 Germany
-
 Ghana
Ghana
-
 Greece
-
 Haiti
Haiti
-
 Hong Kong
-
 Hungary
-
 India
India
-
 Indonesia
-
 Iran, Islamic republic
-
 Iraq
Iraq
-
 Ireland
-
 Israel
-
 Italy
Italy
-
 Jamaica
-
 Japan
Japan
-
 Jordan
-
 Kazakhstan
-
 Kenya
Kenya
-
 Korea
Korea
-
 Kuwait
-
 Kyrgyzstan
-
 Laos
Laos
-
 Latvia
-
 Lebanon
-
 Lesotho
-
 Libya
Libya
-
 Lithuania
-
 Luxembourg
-
 Madagascar
-
 Malaysia
-
 Malta
Malta
-
 Mauritius
-
 Mexico
-
 Moldova
-
 Mongolia
-
 Montenegro
-
 Morocco
-
 Mozambique
-
 Myanmar
-
 Namibia
-
 Nepal
Nepal
-
 Netherlands
-
 New Zealand
-
 Nigeria
-
 North Macedonia
-
 Norway
-
 Oman
Oman
-
 Pakistan
-
 Palestine
-
 Panama
-
 Papua New Guinea
-
 Paraguay
-
 Peru
Peru
-
 Philippines
-
 Poland
-
 Portugal
-
 Puerto Rico
-
 Qatar
Qatar
-
 Reunion
-
 Romania
-
 Rwanda
-
 Saudi Arabia
-
 Serbia
-
 Singapore
-
 Slovakia
-
 Slovenia
-
 Somalia
-
 South Africa
-
 Spain
Spain
-
 Sri Lanka
-
 Sweden
-
 Switzerland
-
 Syria
Syria
-
 Taiwan
-
 Tajikistan
-
 Tanzania
-
 Thailand
-
 Trinidad and Tobago
-
 Tunisia
-
 Turkey
-
 UAE
UAE
-
 Uganda
-
 Ukraine
-
 United Kingdom
-
United States
-
 Uruguay
-
 Uzbekistan
-
 Venezuela
-
 Vietnam
-
 Yemen
Yemen
-
 Zambia
-
 Zimbabwe
- Forex
- Crypto












