

Losses surpass 9% as resistance stalls recovery: Algorand weekly outlook: Can ALGO support come into focus after a stretched decline?

Algorand (ALGO) is trading near $0.08 after falling more than 9% over the past week, as institutional developments remain the main focus. With a fresh round of upgrades underway and new liquidity partnerships aiming to attract larger players, support levels will be closely watched in the days ahead.
 0.132
0.1435
0.132
0.1435
Highlights
- Algorand trades at $0.0795 after falling 9.04% over the past 7 days, showing persistent downward pressure.
- Short-term trend remains negative, with bearish signals across major momentum indicators and notable downside volatility of 12.58%.
- Algorand is expected to consolidate between $0.0743 and $0.0846 in the coming week, with resistance at $0.083 and support at $0.0779.
Ecosystem growth accelerates as protocol upgrade and new liquidity partnerships emerge
Algorand launched version 5.0.0 of its protocol on August 12, 2026, introducing a proposed consensus upgrade featuring post-quantum secure accounts and changes to transaction fees, with node operators currently voting on the initiative. The Algorand Foundation has also partnered with Flow Traders to expand institutional liquidity, offering 24/7 market access and stablecoin or fiat settlement for institutional participants. Validator participation hit a new high above 1,540 nodes in early August, highlighting continued ecosystem growth.
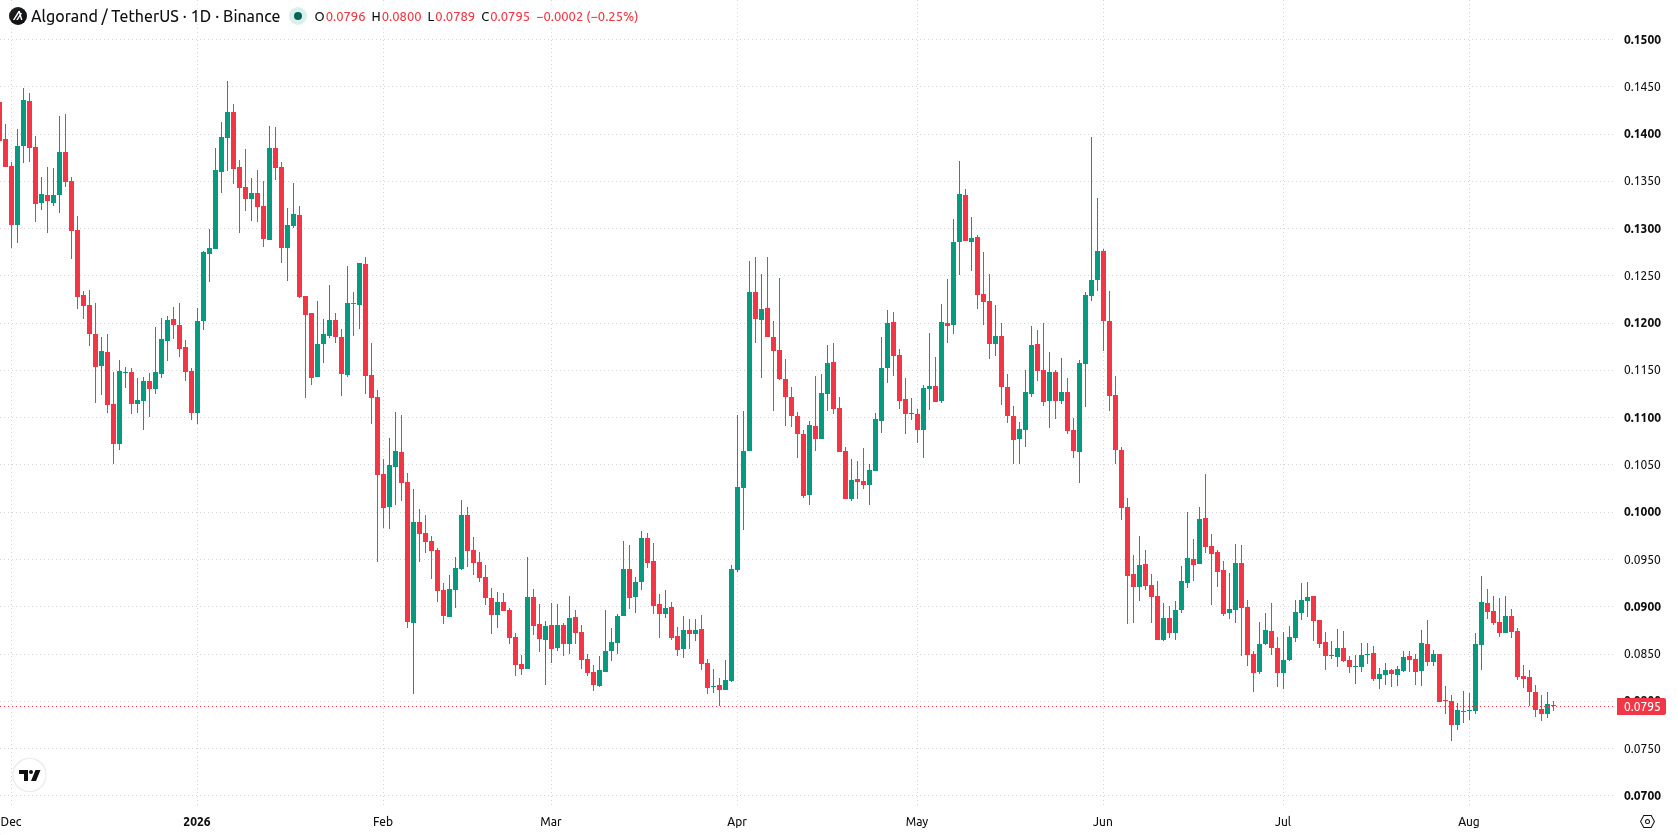
Momentum weakens further as bearish signals and volatility define the week
The daily chart remains weak as the momentum character is defined by a sharp move lower without a sustained trend. MACD, Bull/Bear Power, and the Awesome Oscillator all register bearish signals, while volatility over the past week measured 12.58%. The RSI is approaching oversold at 39.5292, reflecting increasing downside exhaustion. Support sits at $0.0779, with resistance just above at $0.083 and the daily Kijun acting as another cap at $0.0845.
Downside risk prevails as probability skews heavily negative for next week
Over the coming week, Algorand is expected to trade between $0.0743 and $0.0846. The probability of an increase remains very low (less than 20%), while a decrease is highly probable (more than 80%). The base case sees continued consolidation beneath resistance at $0.083. Any sustained move above $0.0846 would suggest a temporary bullish reversal, while a break below $0.0779 would likely accelerate losses toward the lower end of the expected range.
Earlier, analysts noted that Algorand was entering a period of consolidation after a sharp upward move, with limited conviction for a breakout in either direction. The current retracement and persistent bearish signals on the daily chart reinforce the risk of a continued drift lower, making a break below $0.0779 a crucial downside level for traders to monitor.










-
 Afghanistan
-
 Albania
-
 Algeria
-
 Angola
-
 Argentina
-
 Armenia
-
 Australia
-
 Austria
-
 Azerbaijan
-
 Bahamas
-
 Bahrain
-
 Bangladesh
-
 Belarus
-
 Belgium
-
 Bolivia
-
 Botswana
-
 Brazil
-
 Brunei
-
 Bulgaria
-
 Cambodia
-
 Cameroon
-
 Canada
-
 Chile
Chile
-
 China
China
-
 Colombia
-
 Congo
Congo
-
 Costa Rica
-
 Cote d'Ivoire
-
 Croatia
-
 Cuba
Cuba
-
 Cyprus
-
 Czechia
-
 DR Congo
-
 Denmark
-
 Dominican Republic
-
 Ecuador
-
 Egypt
Egypt
-
 El Salvador
-
 Estonia
-
 Eswatini
-
 Ethiopia
-
 Finland
-
 France
-
 Georgia
-
 Germany
-
 Ghana
Ghana
-
 Greece
-
 Haiti
Haiti
-
 Hong Kong
-
 Hungary
-
 India
India
-
 Indonesia
-
 Iran, Islamic republic
-
 Iraq
Iraq
-
 Ireland
-
 Israel
-
 Italy
Italy
-
 Jamaica
-
 Japan
Japan
-
 Jordan
-
 Kazakhstan
-
 Kenya
Kenya
-
 Korea
Korea
-
 Kuwait
-
 Kyrgyzstan
-
 Laos
Laos
-
 Latvia
-
 Lebanon
-
 Lesotho
-
 Libya
Libya
-
 Lithuania
-
 Luxembourg
-
 Madagascar
-
 Malaysia
-
 Malta
Malta
-
 Mauritius
-
 Mexico
-
 Moldova
-
 Mongolia
-
 Montenegro
-
 Morocco
-
 Mozambique
-
 Myanmar
-
 Namibia
-
 Nepal
Nepal
-
 Netherlands
-
 New Zealand
-
 Nigeria
-
 North Macedonia
-
 Norway
-
 Oman
Oman
-
 Pakistan
-
 Palestine
-
 Panama
-
 Papua New Guinea
-
 Paraguay
-
 Peru
Peru
-
 Philippines
-
 Poland
-
 Portugal
-
 Puerto Rico
-
 Qatar
Qatar
-
 Reunion
-
 Romania
-
 Rwanda
-
 Saudi Arabia
-
 Serbia
-
 Singapore
-
 Slovakia
-
 Slovenia
-
 Somalia
-
 South Africa
-
 Spain
Spain
-
 Sri Lanka
-
 Sweden
-
 Switzerland
-
 Syria
Syria
-
 Taiwan
-
 Tajikistan
-
 Tanzania
-
 Thailand
-
 Trinidad and Tobago
-
 Tunisia
-
 Turkey
-
 UAE
UAE
-
 Uganda
-
 Ukraine
-
 United Kingdom
-
United States
-
 Uruguay
-
 Uzbekistan
-
 Venezuela
-
 Vietnam
-
 Yemen
Yemen
-
 Zambia
-
 Zimbabwe
- Forex
- Crypto












