

Render rally continues as breakout above short-term and medium-term averages boosts sentiment

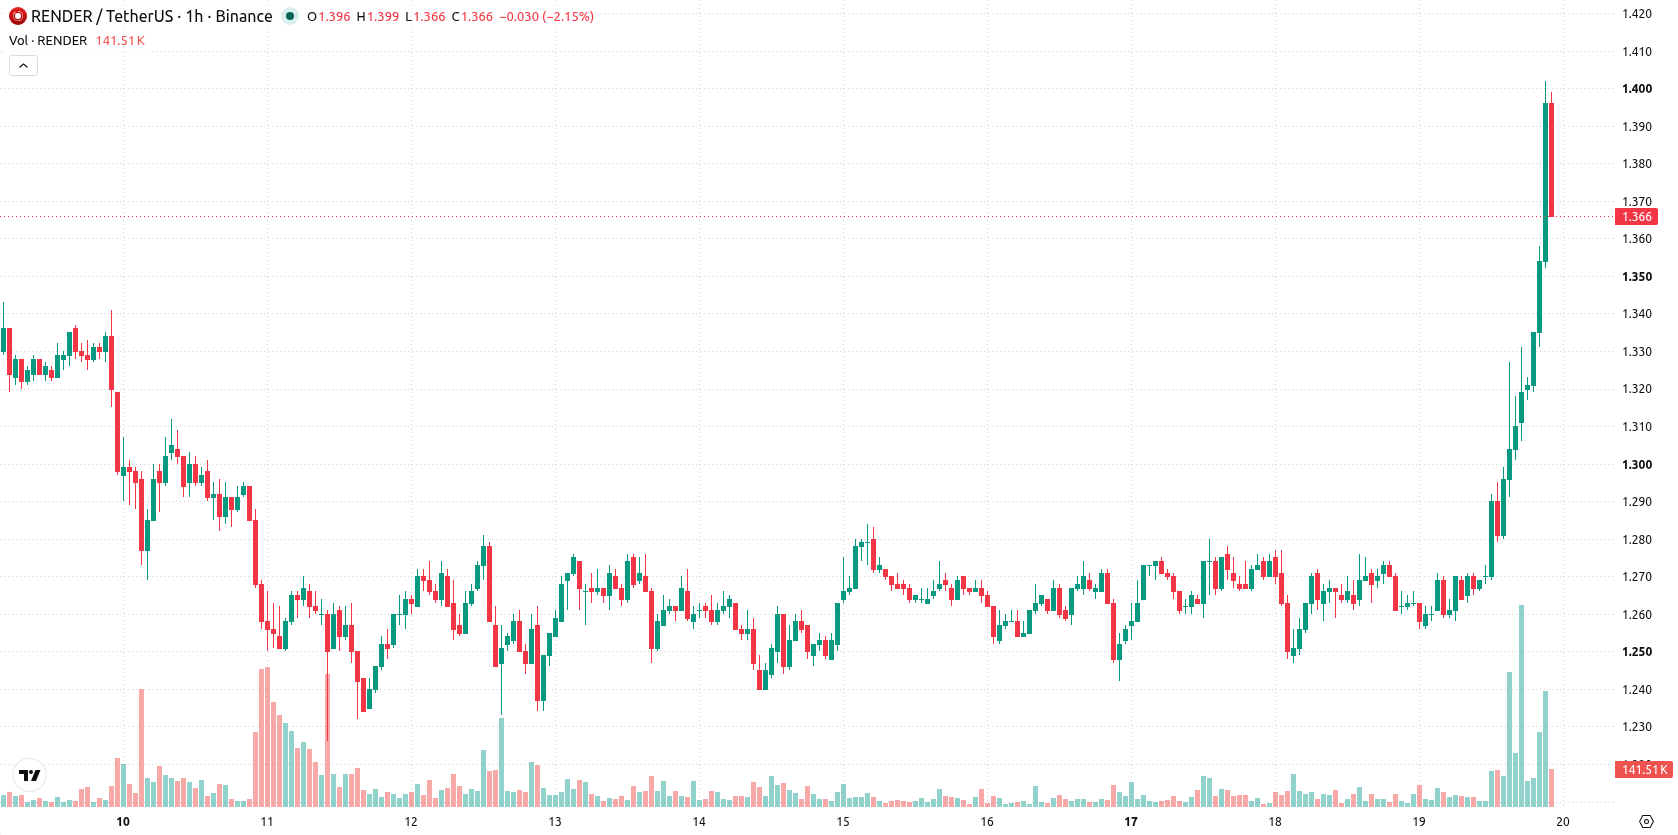
Render (RENDER) is trading at $1.372, rising 8.54% over the last 24 hours and reaching near the session high. The asset is positioned above its key short- and medium-term moving averages, reflecting persistent bullish momentum despite ongoing longer-term resistance.
 1.4
1.6400
Highlights
- Render trades with strong bullish momentum on the short and medium-term charts, but remains under long-term resistance.
- Momentum indicators confirm a pronounced bullish bias, with overbought conditions and intraday volatility as price gained 8.54% to $1.372.
- Expected price range for the next 2 to 3 days is $1.3622 to $1.398, with a probability above 80% for continued upward movement.
Buyer dominance sustained as key indicators highlight overbought levels
On the technical front, RENDER trades above both the MA-20 ($1.2935) and MA-50 ($1.2765) on the hourly chart, while remaining below the long-term MA-200 ($1.6416) on the daily timeframe. The immediate support level is defined by the Ichimoku Kijun at $1.329. Intraday momentum signals remain strongly bullish: MACD and ADX confirm positive direction, while RSI, Stoch RSI, and CCI are all in overbought territory, signaling stretched but sustained buying interest. Bull/Bear Power also highlights buyer dominance, and the Awesome Oscillator is aligned with this upward momentum.
Upside favored as breakout and support levels define risk
Over the next two to three trading days, the anticipated price corridor for RENDER is $1.3622 to $1.398. There is a very high probability (over 80%) of continued upside, while the chance of a downward move is assessed as very low (less than 20%). The baseline case points to ongoing sideways movement within this range, but a bullish scenario would see price breaking above the upper resistance, whereas a bearish outcome could be triggered by a drop below the immediate support level.
Earlier, analysts noted that Render Network was contending with persistent bearish momentum and ongoing pressure on support levels. The current move above key moving averages and the positive intraday momentum now highlight $1.398 as an important resistance threshold for traders monitoring the potential for continued upside or a reversal in the coming sessions.










-
 Afghanistan
-
 Albania
-
 Algeria
-
 Angola
-
 Argentina
-
 Armenia
-
 Australia
-
 Austria
-
 Azerbaijan
-
 Bahamas
-
 Bahrain
-
 Bangladesh
-
 Belarus
-
 Belgium
-
 Bolivia
-
 Botswana
-
 Brazil
-
 Brunei
-
 Bulgaria
-
 Cambodia
-
 Cameroon
-
 Canada
-
 Chile
-
 China
-
 Colombia
-
 Congo
-
 Costa Rica
-
 Cote d'Ivoire
-
 Croatia
-
 Cuba
-
 Cyprus
-
 Czechia
-
 DR Congo
-
 Denmark
-
 Dominican Republic
-
 Ecuador
-
 Egypt
-
 El Salvador
-
 Estonia
-
 Eswatini
-
 Ethiopia
-
 Finland
-
 France
-
 Georgia
-
 Germany
-
 Ghana
-
 Greece
-
 Haiti
-
 Hong Kong
-
 Hungary
-
 India
-
 Indonesia
-
 Iran, Islamic republic
-
 Iraq
-
 Ireland
-
 Israel
-
 Italy
-
 Jamaica
-
 Japan
-
 Jordan
-
 Kazakhstan
-
 Kenya
-
 Korea
-
 Kuwait
-
 Kyrgyzstan
-
 Laos
-
 Latvia
-
 Lebanon
-
 Lesotho
-
 Libya
-
 Lithuania
-
 Luxembourg
-
 Madagascar
-
 Malaysia
-
 Malta
-
 Mauritius
-
 Mexico
-
 Moldova
-
 Mongolia
-
 Montenegro
-
 Morocco
-
 Mozambique
-
 Myanmar
-
 Namibia
-
 Nepal
-
 Netherlands
-
 New Zealand
-
 Nigeria
-
 North Macedonia
-
 Norway
-
 Oman
-
 Pakistan
-
 Palestine
-
 Panama
-
 Papua New Guinea
-
 Paraguay
-
 Peru
-
 Philippines
-
 Poland
-
 Portugal
-
 Puerto Rico
-
 Qatar
-
 Reunion
-
 Romania
-
 Rwanda
-
 Saudi Arabia
-
 Serbia
-
 Singapore
-
 Slovakia
-
 Slovenia
-
 Somalia
-
 South Africa
-
 Spain
-
 Sri Lanka
-
 Sweden
-
 Switzerland
-
 Syria
-
 Taiwan
-
 Tajikistan
-
 Tanzania
-
 Thailand
-
 Trinidad and Tobago
-
 Tunisia
-
 Turkey
-
 UAE
-
 Uganda
-
 Ukraine
-
 United Kingdom
-
United States
-
 Uruguay
-
 Uzbekistan
-
 Venezuela
-
 Vietnam
-
 Yemen
-
 Zambia
-
 Zimbabwe
- Forex
- Crypto












