

ETF optimism keeps Pepe recovery on track as setup looks stretched: weekly forecast

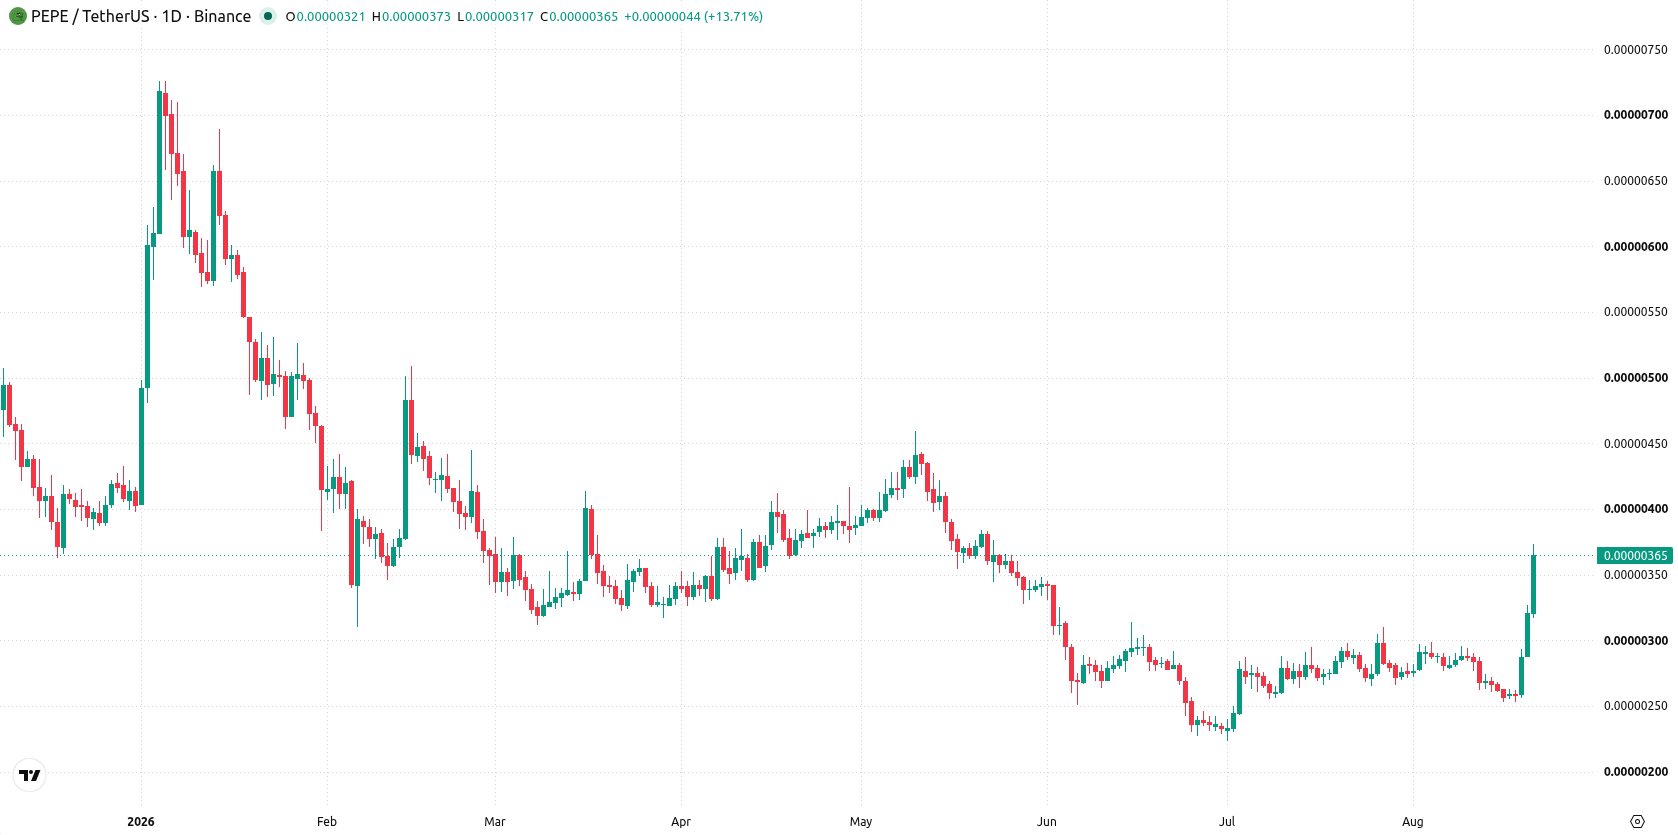
Pepe (PEPE) is holding near $0.0000037 following a surge of nearly 39% this week, as optimism around a prospective ETF and renewed market appetite have driven a sharp recovery. With the setup now looking stretched, prevailing regulatory uncertainty and volatile sentiment set the tone for the week ahead.
 0.0538
0.054080
Highlights
- Pepe climbed 38.87% in the past week to $0.0000037, moving well above key daily moving averages.
- Momentum signals are in overbought territory and volatility is elevated at 29.25%, indicating stretched conditions.
- Over the next 7 days, Pepe is projected to consolidate between $0.000003308 and $0.000004091, with 72% probability of an increase.
Regulatory progress eyed this week as ETF filing shapes sentiment
In April 2026, Canary Capital filed an S-1 registration with the U.S. SEC seeking approval for a spot PEPE ETF, which would be the first regulated fund centered on a meme coin. Coverage from KuCoin and CryptoRank.io notes that this development could enable greater institutional access to PEPE, making regulatory progress a key focus for sentiment in the coming week. No announcements regarding an SEC decision or additional regulatory steps have appeared in top-tier sources since August 2026.
Stretched momentum and volatility prompt consolidation near weekly highs
On the daily chart, the structure is marked by a sharp move higher without a sustained trend, with volatility at 29.25%. Key momentum signals, including RSI at 70.28 and CCI at 198.21, both sit deep in overbought territory, suggesting stretched conditions after the recent advance. While Bull/Bear Power remains supportive of buyers, the broader set of indicators point to consolidation near the top of this week’s range. The nearest support comes from the MA-200 at $0.000003339 and the Ichimoku Kijun at $0.000002895, with price holding just above both levels.
Rangebound outlook for next week as consolidation or breakout risk builds
Over the next 7 days, Pepe is expected to trade between $0.000003308 and $0.000004091. There is a 72% probability of an increase and a 28% probability of a decrease. The base case calls for continued consolidation between support at $0.000003339 and resistance near $0.000004091. A breakout above $0.000004091 could open further gains if bullish momentum persists. A move below $0.000003339 would signal a deeper corrective phase, shifting the bias back to support at the Kijun level.
Previously it was reported that Pepe had established a cautiously bullish bias after breaking a prior downtrend, attracting renewed buying interest amid evolving technical signals. The current analysis builds on this outlook by highlighting elevated volatility and overbought conditions, with traders advised to monitor price action between $0.000003308 and the $0.000004091 resistance band for signs of either sustained consolidation or the next directional move.










-
 Afghanistan
-
 Albania
-
 Algeria
-
 Angola
-
 Argentina
-
 Armenia
-
 Australia
-
 Austria
-
 Azerbaijan
-
 Bahamas
-
 Bahrain
-
 Bangladesh
-
 Belarus
-
 Belgium
-
 Bolivia
-
 Botswana
-
 Brazil
-
 Brunei
-
 Bulgaria
-
 Cambodia
-
 Cameroon
-
 Canada
-
 Chile
-
 China
-
 Colombia
-
 Congo
-
 Costa Rica
-
 Cote d'Ivoire
-
 Croatia
-
 Cuba
-
 Cyprus
-
 Czechia
-
 DR Congo
-
 Denmark
-
 Dominican Republic
-
 Ecuador
-
 Egypt
-
 El Salvador
-
 Estonia
-
 Eswatini
-
 Ethiopia
-
 Finland
-
 France
-
 Georgia
-
 Germany
-
 Ghana
-
 Greece
-
 Haiti
-
 Hong Kong
-
 Hungary
-
 India
-
 Indonesia
-
 Iran, Islamic republic
-
 Iraq
-
 Ireland
-
 Israel
-
 Italy
-
 Jamaica
-
 Japan
-
 Jordan
-
 Kazakhstan
-
 Kenya
-
 Korea
-
 Kuwait
-
 Kyrgyzstan
-
 Laos
-
 Latvia
-
 Lebanon
-
 Lesotho
-
 Libya
-
 Lithuania
-
 Luxembourg
-
 Madagascar
-
 Malaysia
-
 Malta
-
 Mauritius
-
 Mexico
-
 Moldova
-
 Mongolia
-
 Montenegro
-
 Morocco
-
 Mozambique
-
 Myanmar
-
 Namibia
-
 Nepal
-
 Netherlands
-
 New Zealand
-
 Nigeria
-
 North Macedonia
-
 Norway
-
 Oman
-
 Pakistan
-
 Palestine
-
 Panama
-
 Papua New Guinea
-
 Paraguay
-
 Peru
-
 Philippines
-
 Poland
-
 Portugal
-
 Puerto Rico
-
 Qatar
-
 Reunion
-
 Romania
-
 Rwanda
-
 Saudi Arabia
-
 Serbia
-
 Singapore
-
 Slovakia
-
 Slovenia
-
 Somalia
-
 South Africa
-
 Spain
-
 Sri Lanka
-
 Sweden
-
 Switzerland
-
 Syria
-
 Taiwan
-
 Tajikistan
-
 Tanzania
-
 Thailand
-
 Trinidad and Tobago
-
 Tunisia
-
 Turkey
-
 UAE
-
 Uganda
-
 Ukraine
-
 United Kingdom
-
United States
-
 Uruguay
-
 Uzbekistan
-
 Venezuela
-
 Vietnam
-
 Yemen
-
 Zambia
-
 Zimbabwe
- Forex
- Crypto












