

US spot Bitcoin ETF inflows surge: Can BTC break $81,125 resistance?

Bitcoin (BTC) is trading at $77,372, up 2.62% on the day, positioned below its short-term averages but maintaining a strong stance above the longer-term trend supports.
 62639.52
66132.01
Highlights
- US spot Bitcoin ETFs recorded $606.29 million in inflows on August 20, the highest daily intake since May 1, reflecting increased institutional allocation.
- Over $3.5 billion in Bitcoin short positions were liquidated in two days, accelerating buying activity and market momentum.
- Bitcoin is trading above long-term support with conflicting technical signals, expected to range between $73,619 and $81,125 over the next 2 to 3 days.
Demand surge accelerates on institutional inflows and regulatory optimism
The US Treasury’s decision to double long-term bond buybacks to $4 billion per session has triggered renewed demand for hard assets, with Bitcoin directly benefitting as an alternative store of value, according to Finance Yahoo. This surge in demand is further reinforced by US spot Bitcoin ETFs, which saw $606.29 million in inflows on August 20—Blockonomi highlights this as the strongest daily ETF intake since May 1—indicating meaningful institutional allocation behind Bitcoin's market move. Meanwhile, Investing.com reports that a massive short squeeze occurred, with over $3.5 billion in BTC short positions liquidated over two days, amplifying buying momentum. Ongoing regulatory optimism, including bipartisan progress on the CLARITY Act and supportive comments from President Trump, as noted by Businessinsider, has also contributed to sustained institutional inflows, with Investing.com citing the highest weekly spot ETF inflows since January 2026.
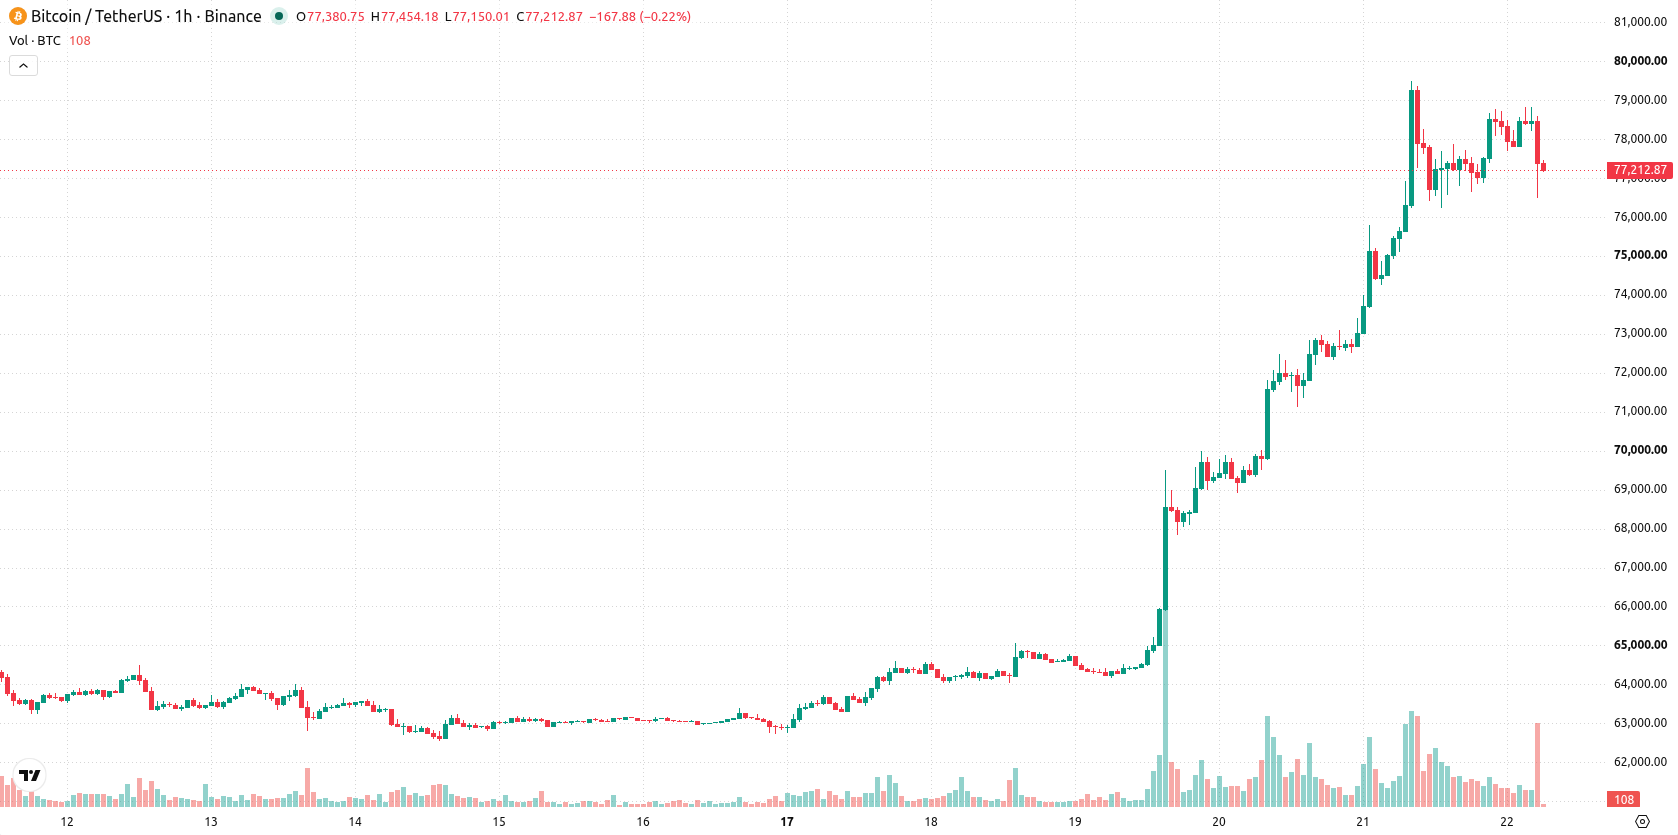
Mixed intraday momentum with key support and overbought signals
BTC/USD sits below the MA-20 while remaining above the MA-50 on the hourly chart and holding a firm position above the MA-200. Immediate support is established at the Ichimoku Kijun level of $77,005 on the daily timeframe. MACD and ADX both show strong buy signals, though the Stoch RSI is oversold and the RSI continues to indicate a buy bias. CCI appears neutral, and Bull/Bear Power reflects current intraday buyer dominance but is flagged as overbought. The Awesome Oscillator remains neutral and does not confirm the trend. Momentum indicator signals conflict, reflecting mixed intraday dynamics with recent buying strength diverging from oscillators.
Rangebound outlook with breakout risks shaping near-term direction
Over the next 2–3 trading days, BTC/USD is expected to remain in a range between $73,619 and $81,125, defining a typical volatility band relative to current levels. The probability of an upward move stands at 68%, while a downside break is less likely at 32%. The baseline scenario anticipates consolidation within this range. Should price move above resistance, renewed upside momentum could follow, while a drop below support may accelerate losses toward the lower bound.
Earlier, analysts noted that robust institutional inflows and macroeconomic developments were supporting a bullish outlook for Bitcoin. The latest surge in ETF inflows, combined with significant short liquidations and evolving regulatory signals, further reinforces the positive structure, making the $81,125 resistance a critical level to watch for a potential breakout in the coming sessions.











-
 Afghanistan
-
 Albania
-
 Algeria
-
 Angola
-
 Argentina
-
 Armenia
-
 Australia
-
 Austria
-
 Azerbaijan
-
 Bahamas
-
 Bahrain
-
 Bangladesh
-
 Belarus
-
 Belgium
-
 Bolivia
-
 Botswana
-
 Brazil
-
 Brunei
-
 Bulgaria
-
 Cambodia
-
 Cameroon
-
 Canada
-
 Chile
-
 China
-
 Colombia
-
 Congo
-
 Costa Rica
-
 Cote d'Ivoire
-
 Croatia
-
 Cuba
-
 Cyprus
-
 Czechia
-
 DR Congo
-
 Denmark
-
 Dominican Republic
-
 Ecuador
-
 Egypt
-
 El Salvador
-
 Estonia
-
 Eswatini
-
 Ethiopia
-
 Finland
-
 France
-
 Georgia
-
 Germany
-
 Ghana
-
 Greece
-
 Haiti
-
 Hong Kong
-
 Hungary
-
 India
-
 Indonesia
-
 Iran, Islamic republic
-
 Iraq
-
 Ireland
-
 Israel
-
 Italy
-
 Jamaica
-
 Japan
-
 Jordan
-
 Kazakhstan
-
 Kenya
-
 Korea
-
 Kuwait
-
 Kyrgyzstan
-
 Laos
-
 Latvia
-
 Lebanon
-
 Lesotho
-
 Libya
-
 Lithuania
-
 Luxembourg
-
 Madagascar
-
 Malaysia
-
 Malta
-
 Mauritius
-
 Mexico
-
 Moldova
-
 Mongolia
-
 Montenegro
-
 Morocco
-
 Mozambique
-
 Myanmar
-
 Namibia
-
 Nepal
-
 Netherlands
-
 New Zealand
-
 Nigeria
-
 North Macedonia
-
 Norway
-
 Oman
-
 Pakistan
-
 Palestine
-
 Panama
-
 Papua New Guinea
-
 Paraguay
-
 Peru
-
 Philippines
-
 Poland
-
 Portugal
-
 Puerto Rico
-
 Qatar
-
 Reunion
-
 Romania
-
 Rwanda
-
 Saudi Arabia
-
 Serbia
-
 Singapore
-
 Slovakia
-
 Slovenia
-
 Somalia
-
 South Africa
-
 Spain
-
 Sri Lanka
-
 Sweden
-
 Switzerland
-
 Syria
-
 Taiwan
-
 Tajikistan
-
 Tanzania
-
 Thailand
-
 Trinidad and Tobago
-
 Tunisia
-
 Turkey
-
 UAE
-
 Uganda
-
 Ukraine
-
 United Kingdom
-
United States
-
 Uruguay
-
 Uzbekistan
-
 Venezuela
-
 Vietnam
-
 Yemen
-
 Zambia
-
 Zimbabwe
- Forex
- Crypto












