

Render under support pressure: Downside targets to watch

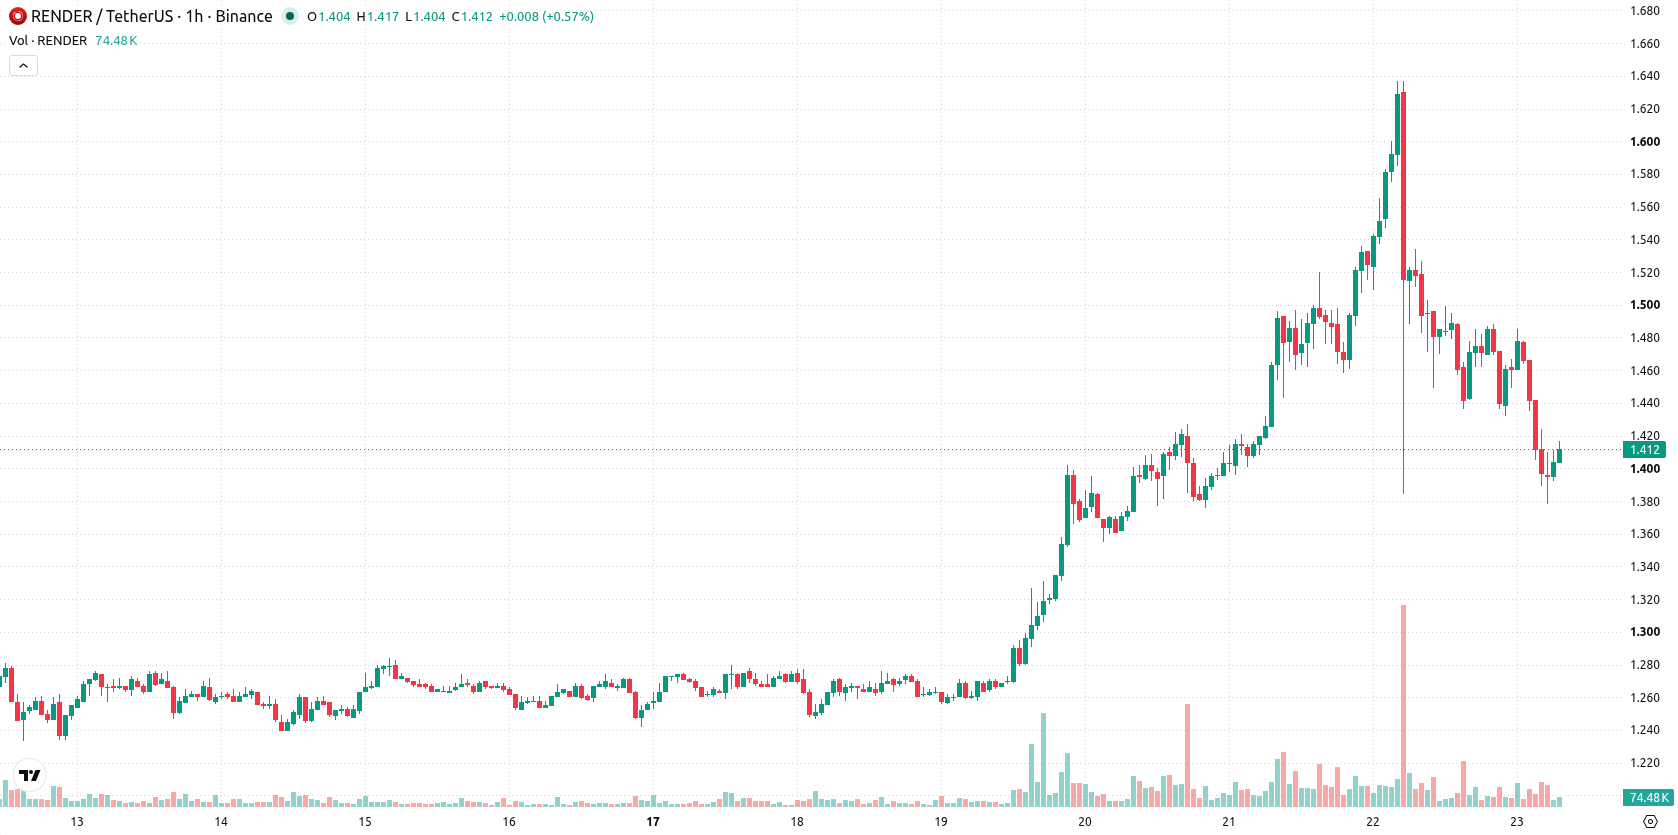
Render (RENDER) is trading at $1.412, marking a 7.04% drop for the day. The token currently sits below its key moving averages, reflecting continued intraday downside pressure.
 1.411
1.6400
Highlights
- RENDER/USD trades below key moving averages across all timeframes, indicating persistent selling pressure and a maintained downtrend.
- Momentum and trend indicators show negative signals, with MACD, ADX, bearish oscillators and high volatility supporting further downside risk.
- Price is projected to consolidate between $1.3248 and $1.4992 over the next 2 to 3 days, with a 76% probability of a downward move.
Bearish momentum confirmed as resistance holds and sellers dominate
On the hourly chart, RENDER/USD remains below the MA-20 at $1.4509 and MA-50 at $1.4836, with the long-term MA-200 well above at $1.6389. The Ichimoku Kijun sits at $1.456 and serves as immediate resistance. Momentum indicators confirm a bearish setup, with both MACD and ADX signaling Sell. The RSI is at 38.95, indicating a Sell bias, while Stoch RSI is Neutral and CCI is Oversold—pointing to short-term exhaustion though not yet a reversal. Bull/Bear Power continues to register seller dominance, and the Awesome Oscillator supports the prevailing downward trend.
Sideways bias as volatility persists and downside risk outweighs
For the next 2–3 trading days, RENDER is expected to trade within a range of $1.3248 to $1.4992. The probability of an upward move stands at 24%, while a downward move is considerably more likely at 76%. The baseline scenario points to price consolidating sideways within this volatility band. A break above $1.456 would open a bullish scenario, while a decline below $1.3248 would likely see RENDER test further support.
Earlier, analysts noted that Render was exhibiting near-term bullish momentum but faced significant technical resistance. The current breakdown below moving averages and persistent downside pressure signals a shift to a bearish bias, making $1.3248 a critical support level to watch for further weakness in the days ahead.









-
 Afghanistan
-
 Albania
-
 Algeria
-
 Angola
-
 Argentina
-
 Armenia
-
 Australia
-
 Austria
-
 Azerbaijan
-
 Bahamas
-
 Bahrain
-
 Bangladesh
-
 Belarus
-
 Belgium
-
 Bolivia
-
 Botswana
-
 Brazil
-
 Brunei
-
 Bulgaria
-
 Cambodia
-
 Cameroon
-
 Canada
-
 Chile
-
 China
-
 Colombia
-
 Congo
-
 Costa Rica
-
 Cote d'Ivoire
-
 Croatia
-
 Cuba
-
 Cyprus
-
 Czechia
-
 DR Congo
-
 Denmark
-
 Dominican Republic
-
 Ecuador
-
 Egypt
-
 El Salvador
-
 Estonia
-
 Eswatini
-
 Ethiopia
-
 Finland
-
 France
-
 Georgia
-
 Germany
-
 Ghana
-
 Greece
-
 Haiti
-
 Hong Kong
-
 Hungary
-
 India
-
 Indonesia
-
 Iran, Islamic republic
-
 Iraq
-
 Ireland
-
 Israel
-
 Italy
-
 Jamaica
-
 Japan
-
 Jordan
-
 Kazakhstan
-
 Kenya
-
 Korea
-
 Kuwait
-
 Kyrgyzstan
-
 Laos
-
 Latvia
-
 Lebanon
-
 Lesotho
-
 Libya
-
 Lithuania
-
 Luxembourg
-
 Madagascar
-
 Malaysia
-
 Malta
-
 Mauritius
-
 Mexico
-
 Moldova
-
 Mongolia
-
 Montenegro
-
 Morocco
-
 Mozambique
-
 Myanmar
-
 Namibia
-
 Nepal
-
 Netherlands
-
 New Zealand
-
 Nigeria
-
 North Macedonia
-
 Norway
-
 Oman
-
 Pakistan
-
 Palestine
-
 Panama
-
 Papua New Guinea
-
 Paraguay
-
 Peru
-
 Philippines
-
 Poland
-
 Portugal
-
 Puerto Rico
-
 Qatar
-
 Reunion
-
 Romania
-
 Rwanda
-
 Saudi Arabia
-
 Serbia
-
 Singapore
-
 Slovakia
-
 Slovenia
-
 Somalia
-
 South Africa
-
 Spain
-
 Sri Lanka
-
 Sweden
-
 Switzerland
-
 Syria
-
 Taiwan
-
 Tajikistan
-
 Tanzania
-
 Thailand
-
 Trinidad and Tobago
-
 Tunisia
-
 Turkey
-
 UAE
-
 Uganda
-
 Ukraine
-
 United Kingdom
-
United States
-
 Uruguay
-
 Uzbekistan
-
 Venezuela
-
 Vietnam
-
 Yemen
-
 Zambia
-
 Zimbabwe
- Forex
- Crypto












