


DeXe (DEXE) surged 29.80% today as technical momentum and a powerful short-term rebound fueled strong buying interest. The move looks limited, with DEXE still trading well below its 50-day and 200-day moving averages and broader trend signals remaining bearish.
 1.16
1.30
Highlights
- DEXE/USD rebounded above the short-term average but remains below both medium- and long-term trend lines.
- Technical signals conflict, with oscillators in overbought territory despite momentum indicators showing strong sell conditions.
- Forecast range for the next five days is $2.06 to $2.88, with a 67% probability of a downward move.
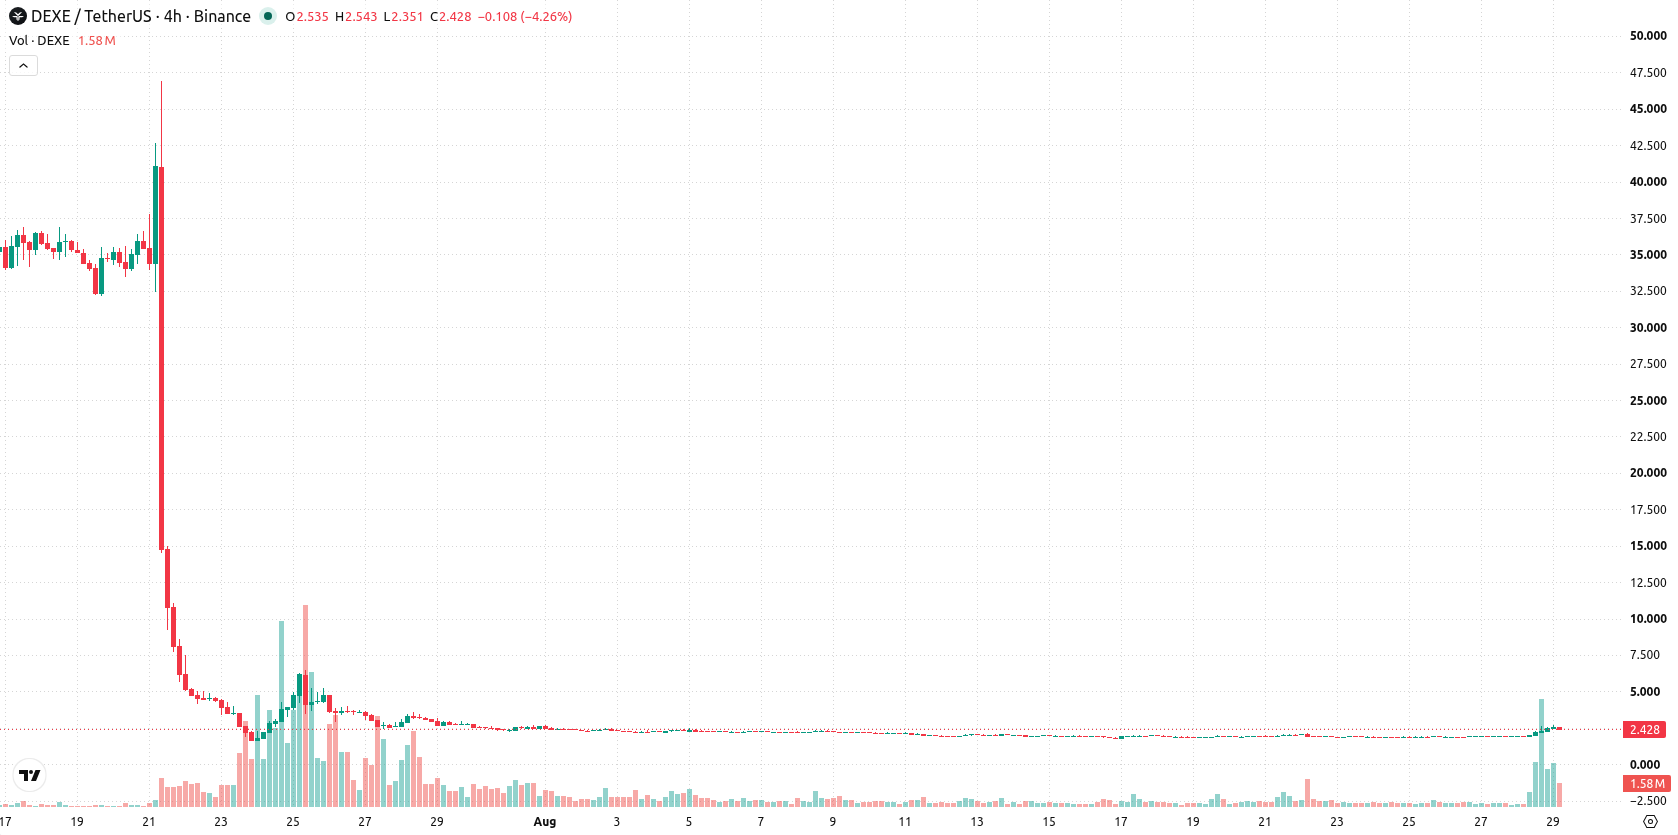
Bearish momentum persists as intraday rally meets technical resistance
DEXE/USD is trading above the 20-day moving average ($1.97), but remains well below both the 50-day ($10.3) and 200-day ($11.5) moving averages. This configuration shows a rebound from recent lows, with short-term improvement, yet the medium- and long-term structure points to ongoing bearish pressure; Ichimoku Kijun at $2.22 serves as interim support. The near-term ceiling is set at $2.52, and the near-term floor at $2.39. Momentum readings are mixed. The Moving Average Convergence Divergence (MACD) signals strong sell and the Average Directional Index (ADX) also points to seller dominance. The Relative Strength Index (RSI) at 35.52 flashes a sell signal and confirms only modest strength, but both Stochastic RSI and Commodity Channel Index (CCI) indicate overbought conditions. Bull/Bear Power (BBP) stands at 0.56, so buyers currently lead intraday momentum and this reading is in overbought territory. The pair gapped to the upside by approximately $0.56 (29.32%), currently sits mid-range within today’s $2.39–$2.52 band, and daily volatility stands at 5.44%. The tone is strong after the open. Momentum and oscillator conflicts warn of possible exhaustion.
Earlier, analysts noted that DeXe had shifted from a bearish technical structure toward a range-bound outlook, as momentum signals became more mixed. The latest multi-day volatility and continued conflict among momentum indicators suggest traders should closely monitor the $2.39 support and $2.52 resistance for potential breakouts that could define the next directional move.










-
 Afghanistan
-
 Albania
-
 Algeria
-
 Angola
-
 Argentina
-
 Armenia
-
 Australia
-
 Austria
-
 Azerbaijan
-
 Bahamas
-
 Bahrain
-
 Bangladesh
-
 Belarus
-
 Belgium
-
 Bolivia
-
 Botswana
-
 Brazil
-
 Brunei
-
 Bulgaria
-
 Cambodia
-
 Cameroon
-
 Canada
-
 Chile
-
 China
-
 Colombia
-
 Congo
-
 Costa Rica
-
 Cote d'Ivoire
-
 Croatia
-
 Cuba
-
 Cyprus
-
 Czechia
-
 DR Congo
-
 Denmark
-
 Dominican Republic
-
 Ecuador
-
 Egypt
-
 El Salvador
-
 Estonia
-
 Eswatini
-
 Ethiopia
-
 Finland
-
 France
-
 Georgia
-
 Germany
-
 Ghana
-
 Greece
-
 Haiti
-
 Hong Kong
-
 Hungary
-
 India
-
 Indonesia
-
 Iran, Islamic republic
-
 Iraq
-
 Ireland
-
 Israel
-
 Italy
-
 Jamaica
-
 Japan
-
 Jordan
-
 Kazakhstan
-
 Kenya
-
 Korea
-
 Kuwait
-
 Kyrgyzstan
-
 Laos
-
 Latvia
-
 Lebanon
-
 Lesotho
-
 Libya
-
 Lithuania
-
 Luxembourg
-
 Madagascar
-
 Malaysia
-
 Malta
-
 Mauritius
-
 Mexico
-
 Moldova
-
 Mongolia
-
 Montenegro
-
 Morocco
-
 Mozambique
-
 Myanmar
-
 Namibia
-
 Nepal
-
 Netherlands
-
 New Zealand
-
 Nigeria
-
 North Macedonia
-
 Norway
-
 Oman
-
 Pakistan
-
 Palestine
-
 Panama
-
 Papua New Guinea
-
 Paraguay
-
 Peru
-
 Philippines
-
 Poland
-
 Portugal
-
 Puerto Rico
-
 Qatar
-
 Reunion
-
 Romania
-
 Rwanda
-
 Saudi Arabia
-
 Serbia
-
 Singapore
-
 Slovakia
-
 Slovenia
-
 Somalia
-
 South Africa
-
 Spain
-
 Sri Lanka
-
 Sweden
-
 Switzerland
-
 Syria
-
 Taiwan
-
 Tajikistan
-
 Tanzania
-
 Thailand
-
 Trinidad and Tobago
-
 Tunisia
-
 Turkey
-
 UAE
-
 Uganda
-
 Ukraine
-
 United Kingdom
-
United States
-
 Uruguay
-
 Uzbekistan
-
 Venezuela
-
 Vietnam
-
 Yemen
-
 Zambia
-
 Zimbabwe
- Forex
- Crypto












