

Fetch.ai drops around 10.5% after persistent downside pressure and lack of new catalysts

Fetch.ai (FET) dropped 10.43% as selling momentum and lack of new catalysts drove prices lower. The move is supported by persistent downside pressure, with FET trading above its 20-day moving average but below both its 50-day and 200-day averages, pointing to near-term support and ongoing medium- and long-term weakness.
 0.2142
0.2443
0.2142
0.2443
Highlights
- FET/USD trades above its short-term average but remains under medium- and long-term moving averages, indicating lingering seller pressure.
- Momentum indicators deliver mixed signals, with some showing emerging buyer dominance and others remaining neutral ahead of the next move.
- FET/USD is expected to drift between $0.1309 and $0.1613 over five days, with a 62% probability of a downward move.
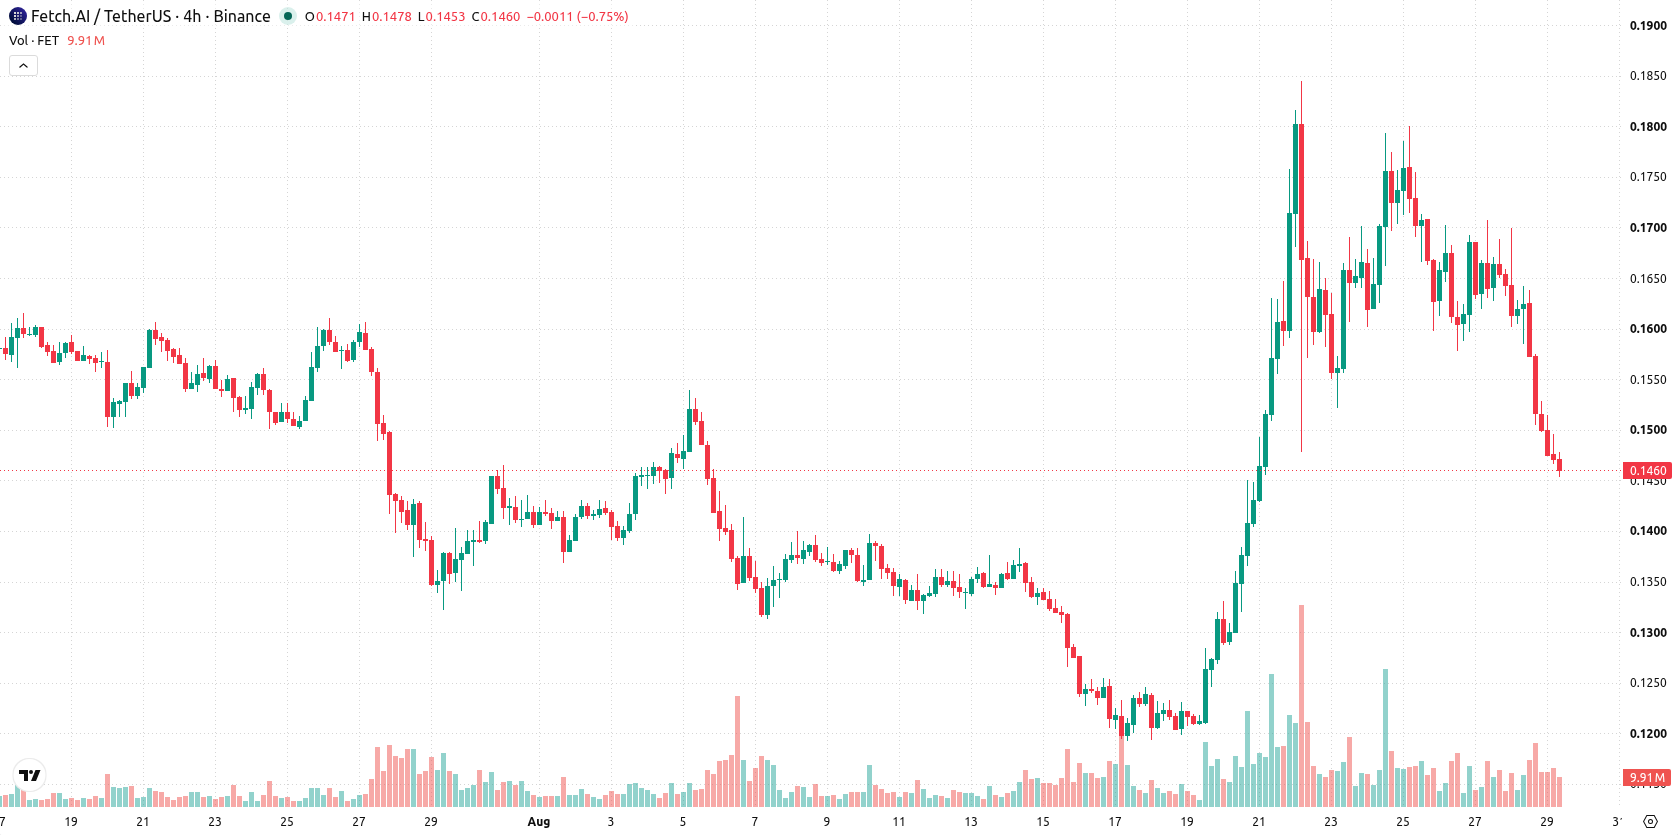
Short-term support holds as mixed momentum tempers bearish trend
FET/USD currently trades above its 20-day moving average (MA-20) at $0.1449 but remains below the 50-day (MA-50) at $0.1482 and 200-day (MA-200) at $0.1879, showing immediate support with longer-term selling pressure. The near-term resistance is at $0.147, while support is established at $0.1449. The Ichimoku Kijun at $0.1518 acts as nearby resistance, and the overall trend continues to look bearish. Momentum indicators present mixed signals. MACD and ADX both point to strengthening upward momentum, whereas RSI is neutral at 50.69 with a buy forecast, and CCI also favors buyers. The Stochastic RSI and Awesome Oscillator remain neutral. Bull/Bear Power (BBP) is positive at 0.0152, indicating intraday buying, but price is near the low of the day with volatility at 3.06%. Persistent pressure is evident after the downside gap, which aligns with building intraday momentum, not outright seller control.
Earlier, analysts noted that Fetch.ai remained under sustained downside pressure with a bearish technical outlook. Current price action both confirms the ongoing vulnerability and introduces heightened short-term volatility, making the support at $0.1449 a critical level to monitor for potential further declines.










-
 Afghanistan
-
 Albania
-
 Algeria
-
 Angola
-
 Argentina
-
 Armenia
-
 Australia
-
 Austria
-
 Azerbaijan
-
 Bahamas
-
 Bahrain
-
 Bangladesh
-
 Belarus
-
 Belgium
-
 Bolivia
-
 Botswana
-
 Brazil
-
 Brunei
-
 Bulgaria
-
 Cambodia
-
 Cameroon
-
 Canada
-
 Chile
Chile
-
 China
China
-
 Colombia
-
 Congo
Congo
-
 Costa Rica
-
 Cote d'Ivoire
-
 Croatia
-
 Cuba
Cuba
-
 Cyprus
-
 Czechia
-
 DR Congo
-
 Denmark
-
 Dominican Republic
-
 Ecuador
-
 Egypt
Egypt
-
 El Salvador
-
 Estonia
-
 Eswatini
-
 Ethiopia
-
 Finland
-
 France
-
 Georgia
-
 Germany
-
 Ghana
Ghana
-
 Greece
-
 Haiti
Haiti
-
 Hong Kong
-
 Hungary
-
 India
India
-
 Indonesia
-
 Iran, Islamic republic
-
 Iraq
Iraq
-
 Ireland
-
 Israel
-
 Italy
Italy
-
 Jamaica
-
 Japan
Japan
-
 Jordan
-
 Kazakhstan
-
 Kenya
Kenya
-
 Korea
Korea
-
 Kuwait
-
 Kyrgyzstan
-
 Laos
Laos
-
 Latvia
-
 Lebanon
-
 Lesotho
-
 Libya
Libya
-
 Lithuania
-
 Luxembourg
-
 Madagascar
-
 Malaysia
-
 Malta
Malta
-
 Mauritius
-
 Mexico
-
 Moldova
-
 Mongolia
-
 Montenegro
-
 Morocco
-
 Mozambique
-
 Myanmar
-
 Namibia
-
 Nepal
Nepal
-
 Netherlands
-
 New Zealand
-
 Nigeria
-
 North Macedonia
-
 Norway
-
 Oman
Oman
-
 Pakistan
-
 Palestine
-
 Panama
-
 Papua New Guinea
-
 Paraguay
-
 Peru
Peru
-
 Philippines
-
 Poland
-
 Portugal
-
 Puerto Rico
-
 Qatar
Qatar
-
 Reunion
-
 Romania
-
 Rwanda
-
 Saudi Arabia
-
 Serbia
-
 Singapore
-
 Slovakia
-
 Slovenia
-
 Somalia
-
 South Africa
-
 Spain
Spain
-
 Sri Lanka
-
 Sweden
-
 Switzerland
-
 Syria
Syria
-
 Taiwan
-
 Tajikistan
-
 Tanzania
-
 Thailand
-
 Trinidad and Tobago
-
 Tunisia
-
 Turkey
-
 UAE
UAE
-
 Uganda
-
 Ukraine
-
 United Kingdom
-
United States
-
 Uruguay
-
 Uzbekistan
-
 Venezuela
-
 Vietnam
-
 Yemen
Yemen
-
 Zambia
-
 Zimbabwe
- Forex
- Crypto












