

Movement price forecast: Support pressure builds

Movement (MOVE) is trading at $0.0086, marking a daily decline of 7.53%. The asset is positioned below its key moving averages, reflecting prevailing selling pressure.
 0.0049
0.005562
Highlights
- MOVE/USD trades below key moving averages and has dropped 7.53% today, indicating sustained bearish momentum across all timeframes.
- Momentum indicators are mostly bearish, with near-oversold conditions and dominant seller influence, though some oscillators suggest a potential intraday rebound.
- Expected trading range for the next one to three days is $0.0072 to $0.0091, with a 74% probability of a downward move.
Bearish signals widen as momentum weakens, resistance caps upside
MOVE/USD encountered a bearish technical setup, trading below the MA-20 ($0.0089), MA-50 ($0.009), and well under the MA-200 ($0.0152). The Ichimoku Kijun level at $0.009 is acting as immediate resistance. Among momentum indicators, MACD confirms continuing selling, and ADX remains neutral, indicating an absence of strong trend dominance. Oscillators are conflicted: RSI hovers just above oversold at 40, CCI also signals oversold, and Stoch RSI suggests a potential for intraday rebound. However, Bull/Bear Power highlights prevailing seller pressure and the Awesome Oscillator supports the current downward momentum.
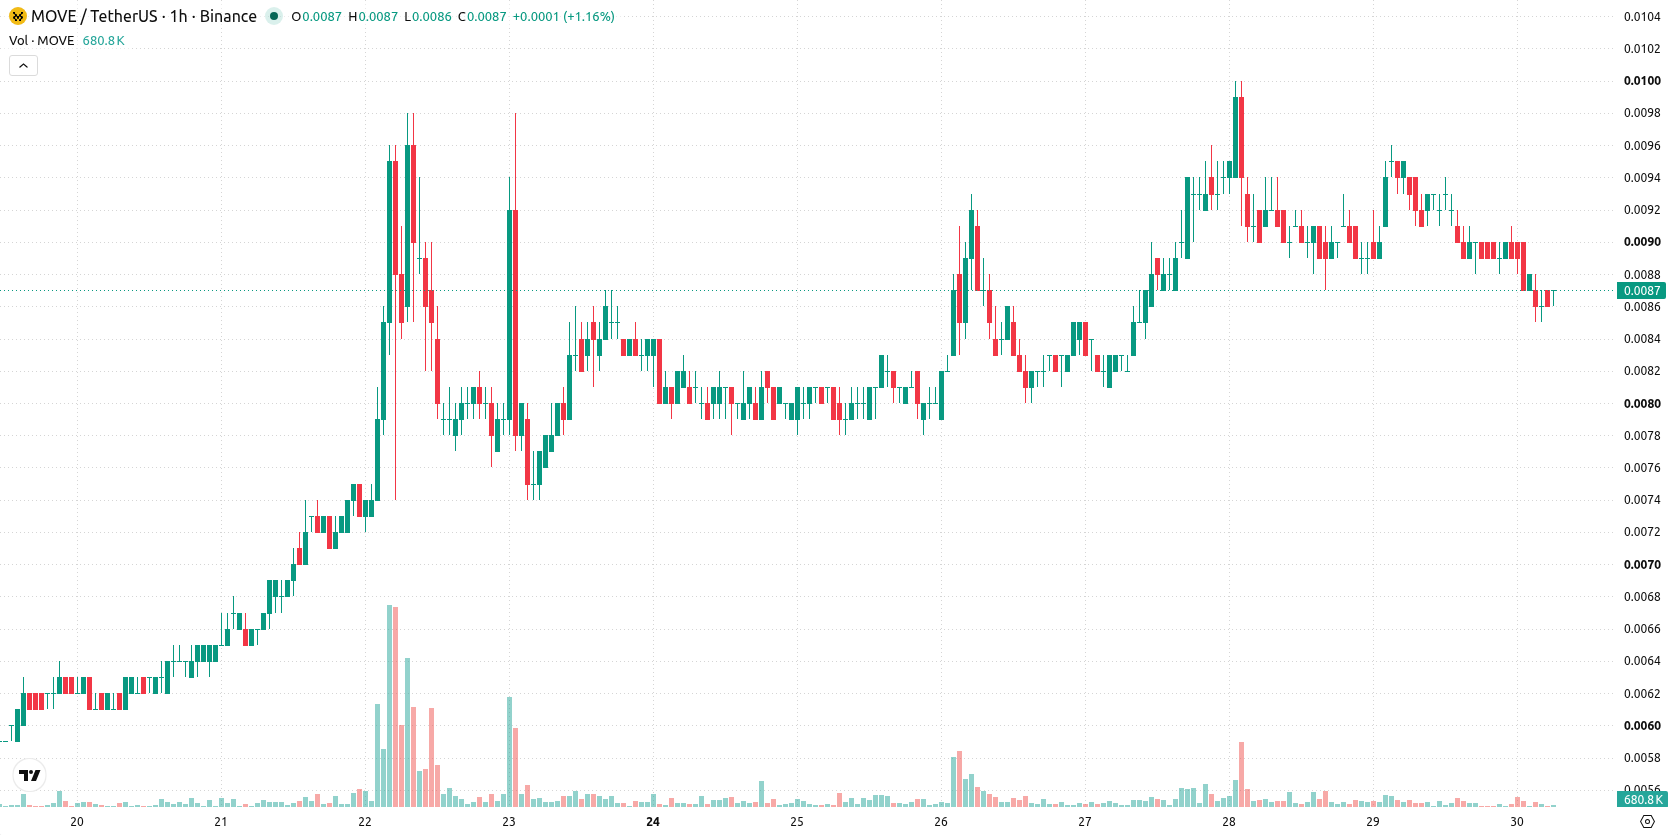
Downtrend risk persists with consolidation likely barring breakout
Over the next one to three days, MOVE/USD is expected to trade in a band between $0.0072 and $0.0091. Probabilities favor continuation to the downside, with only a 26% chance of an upward move versus a 74% likelihood of further weakness. The base case is for sideways consolidation within this range; any move above $0.009 would trigger a bullish scenario, while a drop below $0.0072 may accelerate additional losses.
Earlier, analysts noted that Movement displayed resilience in the short and medium term, despite underlying long-term technical challenges. The present shift to below-key averages marks a notable change, and traders should closely monitor the $0.0072 level as potential downside momentum could intensify on a break below this support.










-
 Afghanistan
-
 Albania
-
 Algeria
-
 Angola
-
 Argentina
-
 Armenia
-
 Australia
-
 Austria
-
 Azerbaijan
-
 Bahamas
-
 Bahrain
-
 Bangladesh
-
 Belarus
-
 Belgium
-
 Bolivia
-
 Botswana
-
 Brazil
-
 Brunei
-
 Bulgaria
-
 Cambodia
-
 Cameroon
-
 Canada
-
 Chile
-
 China
-
 Colombia
-
 Congo
-
 Costa Rica
-
 Cote d'Ivoire
-
 Croatia
-
 Cuba
-
 Cyprus
-
 Czechia
-
 DR Congo
-
 Denmark
-
 Dominican Republic
-
 Ecuador
-
 Egypt
-
 El Salvador
-
 Estonia
-
 Eswatini
-
 Ethiopia
-
 Finland
-
 France
-
 Georgia
-
 Germany
-
 Ghana
-
 Greece
-
 Haiti
-
 Hong Kong
-
 Hungary
-
 India
-
 Indonesia
-
 Iran, Islamic republic
-
 Iraq
-
 Ireland
-
 Israel
-
 Italy
-
 Jamaica
-
 Japan
-
 Jordan
-
 Kazakhstan
-
 Kenya
-
 Korea
-
 Kuwait
-
 Kyrgyzstan
-
 Laos
-
 Latvia
-
 Lebanon
-
 Lesotho
-
 Libya
-
 Lithuania
-
 Luxembourg
-
 Madagascar
-
 Malaysia
-
 Malta
-
 Mauritius
-
 Mexico
-
 Moldova
-
 Mongolia
-
 Montenegro
-
 Morocco
-
 Mozambique
-
 Myanmar
-
 Namibia
-
 Nepal
-
 Netherlands
-
 New Zealand
-
 Nigeria
-
 North Macedonia
-
 Norway
-
 Oman
-
 Pakistan
-
 Palestine
-
 Panama
-
 Papua New Guinea
-
 Paraguay
-
 Peru
-
 Philippines
-
 Poland
-
 Portugal
-
 Puerto Rico
-
 Qatar
-
 Reunion
-
 Romania
-
 Rwanda
-
 Saudi Arabia
-
 Serbia
-
 Singapore
-
 Slovakia
-
 Slovenia
-
 Somalia
-
 South Africa
-
 Spain
-
 Sri Lanka
-
 Sweden
-
 Switzerland
-
 Syria
-
 Taiwan
-
 Tajikistan
-
 Tanzania
-
 Thailand
-
 Trinidad and Tobago
-
 Tunisia
-
 Turkey
-
 UAE
-
 Uganda
-
 Ukraine
-
 United Kingdom
-
United States
-
 Uruguay
-
 Uzbekistan
-
 Venezuela
-
 Vietnam
-
 Yemen
-
 Zambia
-
 Zimbabwe
- Forex
- Crypto












