

Support test at $0.000002839: Can Pepe avoid deeper losses?

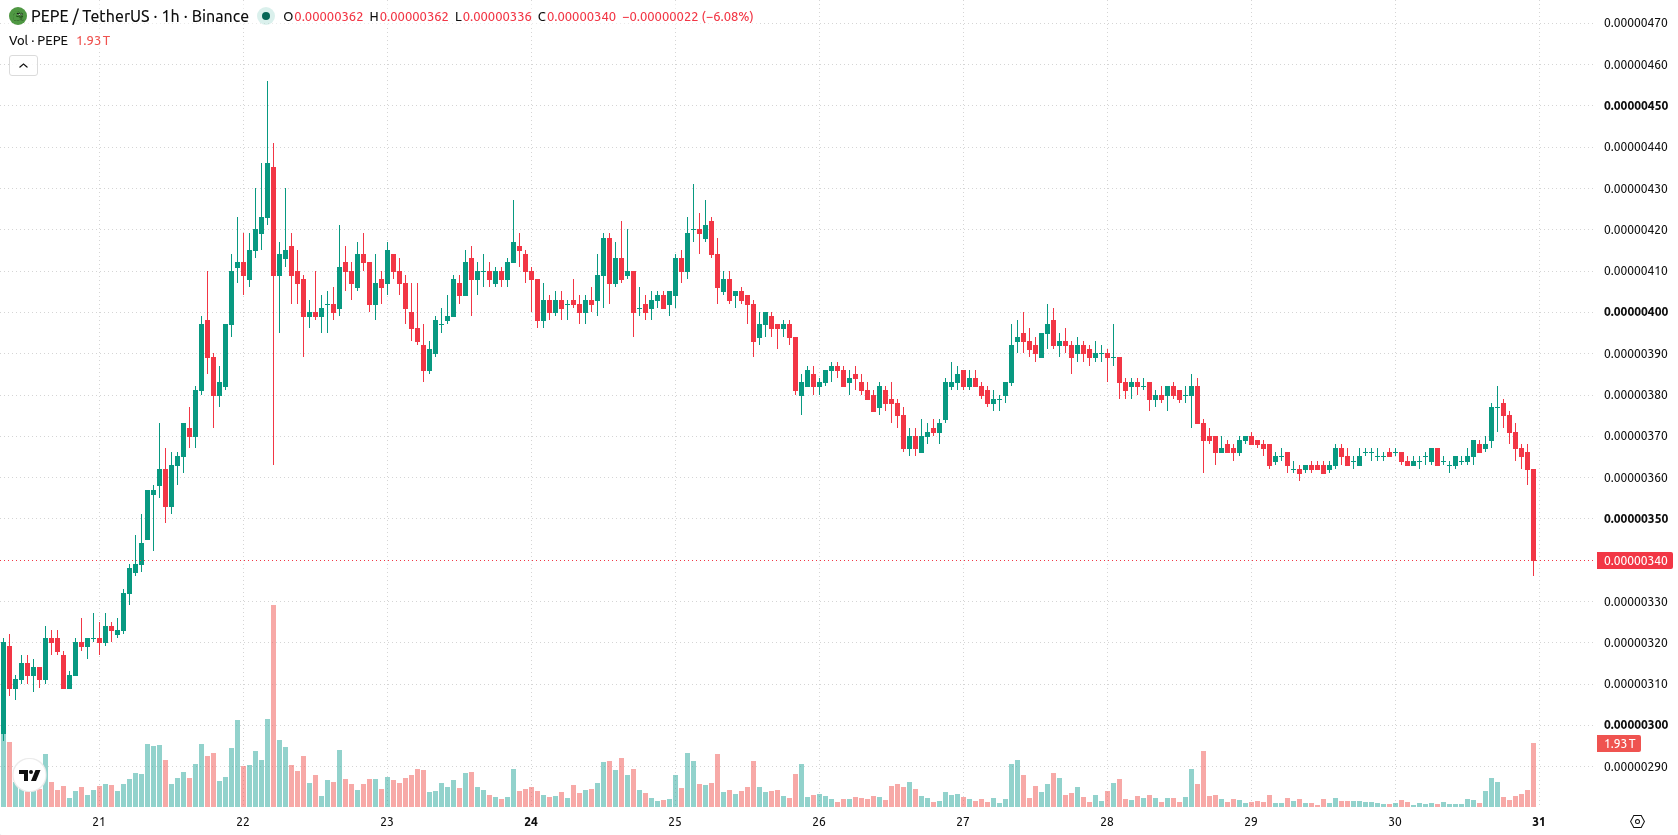
Pepe (PEPE) is trading at $0.000003, marking a daily decline of 7.1% amid heightened volatility. The asset is trading below its key moving averages at this time.
 0.0539
0.055620
Highlights
- Pepe Coin remains just below a long-term descending trendline, with persistent supply pressure containing any upside moves.
- Approaching a major technical area has focused traders on potential breakout or breakdown cues, increasing near-term event risk.
- PEPE/USD trades below key moving averages with strong bearish pressure, a projected 2 to 3 day range of $0.000002839 to $0.00000372, and a 75% probability of further downside.
Upside capped by supply pressure as traders await breakout signals
Pepe Coin (PEPE) has been consolidating just below a long-standing descending trendline, signaling that the asset continues to face persistent technical resistance according to Bravenewcoin. This positioning highlights how supply pressure at this key level has limited upside progress and left market participants cautious. The approach to an important technical area has reinforced trader attention on breakout and breakdown signals, contributing to current sentiment.
Bearish bias prevails as mixed momentum indicators track seller control
On the hourly chart, PEPE/USD is positioned below the MA-20 at $0.000003671 and the MA-50 at $0.000003657, while on the daily chart, the price is also trading under the MA-200 at $0.000003341. The Ichimoku Kijun at $0.000003715 acts as immediate resistance. Momentum indicators present a mixed profile: MACD and ADX both align with buy signals, indicating underlying strength; however, RSI sits at 43.94 (Sell), Stochastic RSI is oversold, and CCI is neutral, reflecting recent weakness. Intraday readings from Bull/Bear Power suggest seller dominance, consistent with the recent sharp move lower.
Downside risk elevated as range persists without breakout catalyst
For the next 2–3 trading days, the expected price range for PEPE is $0.000002839 to $0.00000372. A continued range-bound scenario remains the base case, with a 75% probability of a downward move and only a 25% chance of an upward reversal. A decisive break above the immediate resistance at $0.000003715 could prompt buying, while a close below the $0.000002839 support would likely accelerate declines.
Earlier, analysts noted that Pepe's sustained momentum was contingent on holding above key support levels amid heightened volatility and speculative interest. The current technical breakdown below moving averages signals increased downside risk, making $0.000002839 a critical support to monitor for potential further weakness in the days ahead.






Latest PEPE/USD News




-
 Afghanistan
-
 Albania
-
 Algeria
-
 Angola
-
 Argentina
-
 Armenia
-
 Australia
-
 Austria
-
 Azerbaijan
-
 Bahamas
-
 Bahrain
-
 Bangladesh
-
 Belarus
-
 Belgium
-
 Bolivia
-
 Botswana
-
 Brazil
-
 Brunei
-
 Bulgaria
-
 Cambodia
-
 Cameroon
-
 Canada
-
 Chile
-
 China
-
 Colombia
-
 Congo
-
 Costa Rica
-
 Cote d'Ivoire
-
 Croatia
-
 Cuba
-
 Cyprus
-
 Czechia
-
 DR Congo
-
 Denmark
-
 Dominican Republic
-
 Ecuador
-
 Egypt
-
 El Salvador
-
 Estonia
-
 Eswatini
-
 Ethiopia
-
 Finland
-
 France
-
 Georgia
-
 Germany
-
 Ghana
-
 Greece
-
 Haiti
-
 Hong Kong
-
 Hungary
-
 India
-
 Indonesia
-
 Iran, Islamic republic
-
 Iraq
-
 Ireland
-
 Israel
-
 Italy
-
 Jamaica
-
 Japan
-
 Jordan
-
 Kazakhstan
-
 Kenya
-
 Korea
-
 Kuwait
-
 Kyrgyzstan
-
 Laos
-
 Latvia
-
 Lebanon
-
 Lesotho
-
 Libya
-
 Lithuania
-
 Luxembourg
-
 Madagascar
-
 Malaysia
-
 Malta
-
 Mauritius
-
 Mexico
-
 Moldova
-
 Mongolia
-
 Montenegro
-
 Morocco
-
 Mozambique
-
 Myanmar
-
 Namibia
-
 Nepal
-
 Netherlands
-
 New Zealand
-
 Nigeria
-
 North Macedonia
-
 Norway
-
 Oman
-
 Pakistan
-
 Palestine
-
 Panama
-
 Papua New Guinea
-
 Paraguay
-
 Peru
-
 Philippines
-
 Poland
-
 Portugal
-
 Puerto Rico
-
 Qatar
-
 Reunion
-
 Romania
-
 Rwanda
-
 Saudi Arabia
-
 Serbia
-
 Singapore
-
 Slovakia
-
 Slovenia
-
 Somalia
-
 South Africa
-
 Spain
-
 Sri Lanka
-
 Sweden
-
 Switzerland
-
 Syria
-
 Taiwan
-
 Tajikistan
-
 Tanzania
-
 Thailand
-
 Trinidad and Tobago
-
 Tunisia
-
 Turkey
-
 UAE
-
 Uganda
-
 Ukraine
-
 United Kingdom
-
United States
-
 Uruguay
-
 Uzbekistan
-
 Venezuela
-
 Vietnam
-
 Yemen
-
 Zambia
-
 Zimbabwe
- Forex
- Crypto












