

Arbitrum technical analysis: Resistance test at $0.1261 in focus

Arbitrum (ARB) is trading at $0.1178, up 10.61% on the day. The asset remains positioned above its key moving averages.
 0.1146
0.1374
Highlights
- Robinhood Chain generated a record $1.92 million in daily revenue as adoption of Arbitrum technology increased real-world protocol usage.
- Derivatives activity surged, with 24-hour futures volume up over 700% to $814 million and open interest at $157 million, driven by institutional flows.
- ARB/USD advanced 10.61% on strong buying signals from momentum indicators, with near-term price expected to consolidate in the $0.1095 to $0.1261 range.
Ecosystem growth accelerates as Robinhood and institutional flows surge
Robinhood Chain’s adoption of Arbitrum technology has driven a surge in commercial traction, with the chain generating a record $1.92 million in daily revenue, highlighting increasing real-world demand and utility for the protocol, according to Blockonomi. New revenue-sharing terms under the Arbitrum Expansion Program further strengthen the protocol’s funding base as blockchains settling outside of Arbitrum One or Nova remit 10% of their net revenue to the Arbitrum ecosystem. Momentum has also extended to derivatives markets, where 24-hour futures volume climbed over 700% to $814 million and open interest increased 62% to $157 million, reflecting an uptick in institutional participation, as noted by Coinpedia. In parallel, the recent activation of the ArbBOS Elara upgrade introduces compliance filtering and customizable priority fees, potentially broadening Arbitrum’s appeal to enterprise users.
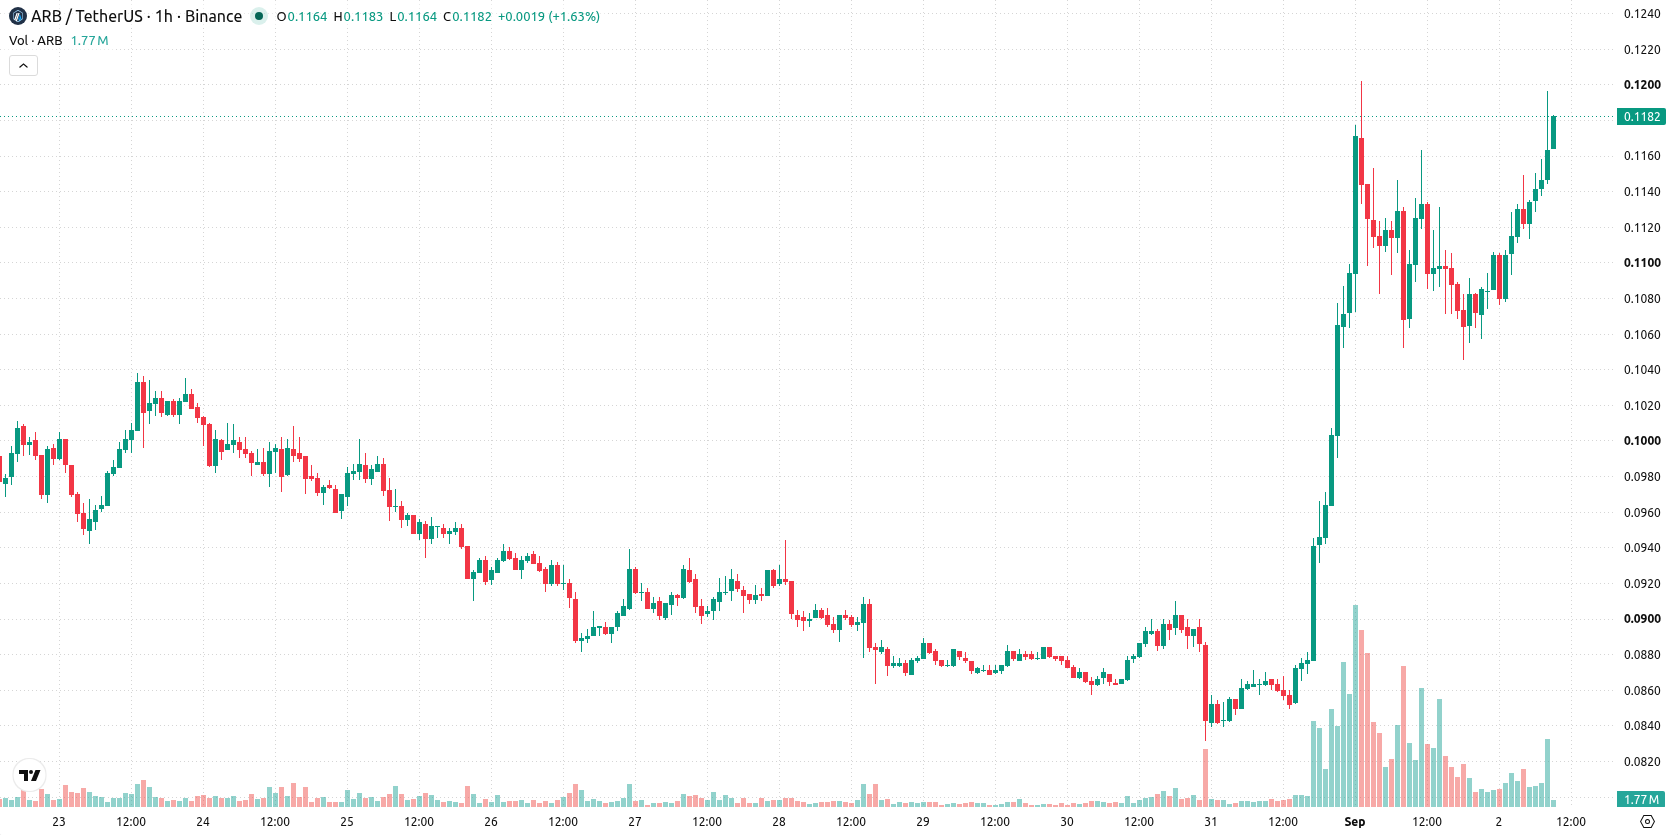
Bullish momentum strengthens as intraday highs and overbought signals persist
On the technical front, ARB trades above the MA-20 and MA-50 on the hourly timeframe while maintaining a position above the MA-200 on the daily chart. The Ichimoku Kijun at $0.111 is acting as immediate support. Momentum indicators remain strongly bullish: MACD and ADX are both on buy signals, RSI is at 68.79, and both Stoch RSI and CCI are in overbought territory. Bull/Bear Power confirms dominance by buyers in the intraday session, and the Awesome Oscillator further validates the prevailing upward trend. Heightened volatility has accompanied the latest move, with price action remaining near intraday highs.
Consolidation likely as upside bias outweighs limited downside risk
Looking ahead one to two trading days, ARB/USD is set to fluctuate within a $0.1095 to $0.1261 band reflecting typical volatility. There is a high probability of continued gains, while marked downside risk is minimal. The baseline scenario involves consolidation inside the projected range. A breakout above resistance could spark additional upside, whereas a drop below $0.111 (the Ichimoku Kijun) would expose the lower end of the expected range.
Earlier, analysts noted that Arbitrum's increased network activity and protocol upgrades had positioned the asset for further upside contingent on sustained momentum. The latest uptrend, reinforced by surging derivative volumes and real-world adoption metrics, supports the case for further gains, with traders advised to watch for a breakout above $0.1261 or a drop below $0.111 as signals for the next directional move.










-
 Afghanistan
-
 Albania
-
 Algeria
-
 Angola
-
 Argentina
-
 Armenia
-
 Australia
-
 Austria
-
 Azerbaijan
-
 Bahamas
-
 Bahrain
-
 Bangladesh
-
 Belarus
-
 Belgium
-
 Bolivia
-
 Botswana
-
 Brazil
-
 Brunei
-
 Bulgaria
-
 Cambodia
-
 Cameroon
-
 Canada
-
 Chile
-
 China
-
 Colombia
-
 Congo
-
 Costa Rica
-
 Cote d'Ivoire
-
 Croatia
-
 Cuba
-
 Cyprus
-
 Czechia
-
 DR Congo
-
 Denmark
-
 Dominican Republic
-
 Ecuador
-
 Egypt
-
 El Salvador
-
 Estonia
-
 Eswatini
-
 Ethiopia
-
 Finland
-
 France
-
 Georgia
-
 Germany
-
 Ghana
-
 Greece
-
 Haiti
-
 Hong Kong
-
 Hungary
-
 India
-
 Indonesia
-
 Iran, Islamic republic
-
 Iraq
-
 Ireland
-
 Israel
-
 Italy
-
 Jamaica
-
 Japan
-
 Jordan
-
 Kazakhstan
-
 Kenya
-
 Korea
-
 Kuwait
-
 Kyrgyzstan
-
 Laos
-
 Latvia
-
 Lebanon
-
 Lesotho
-
 Libya
-
 Lithuania
-
 Luxembourg
-
 Madagascar
-
 Malaysia
-
 Malta
-
 Mauritius
-
 Mexico
-
 Moldova
-
 Mongolia
-
 Montenegro
-
 Morocco
-
 Mozambique
-
 Myanmar
-
 Namibia
-
 Nepal
-
 Netherlands
-
 New Zealand
-
 Nigeria
-
 North Macedonia
-
 Norway
-
 Oman
-
 Pakistan
-
 Palestine
-
 Panama
-
 Papua New Guinea
-
 Paraguay
-
 Peru
-
 Philippines
-
 Poland
-
 Portugal
-
 Puerto Rico
-
 Qatar
-
 Reunion
-
 Romania
-
 Rwanda
-
 Saudi Arabia
-
 Serbia
-
 Singapore
-
 Slovakia
-
 Slovenia
-
 Somalia
-
 South Africa
-
 Spain
-
 Sri Lanka
-
 Sweden
-
 Switzerland
-
 Syria
-
 Taiwan
-
 Tajikistan
-
 Tanzania
-
 Thailand
-
 Trinidad and Tobago
-
 Tunisia
-
 Turkey
-
 UAE
-
 Uganda
-
 Ukraine
-
 United Kingdom
-
United States
-
 Uruguay
-
 Uzbekistan
-
 Venezuela
-
 Vietnam
-
 Yemen
-
 Zambia
-
 Zimbabwe
- Forex
- Crypto












