

Support pressure at $0.0884: Can Plasma avoid deeper losses?

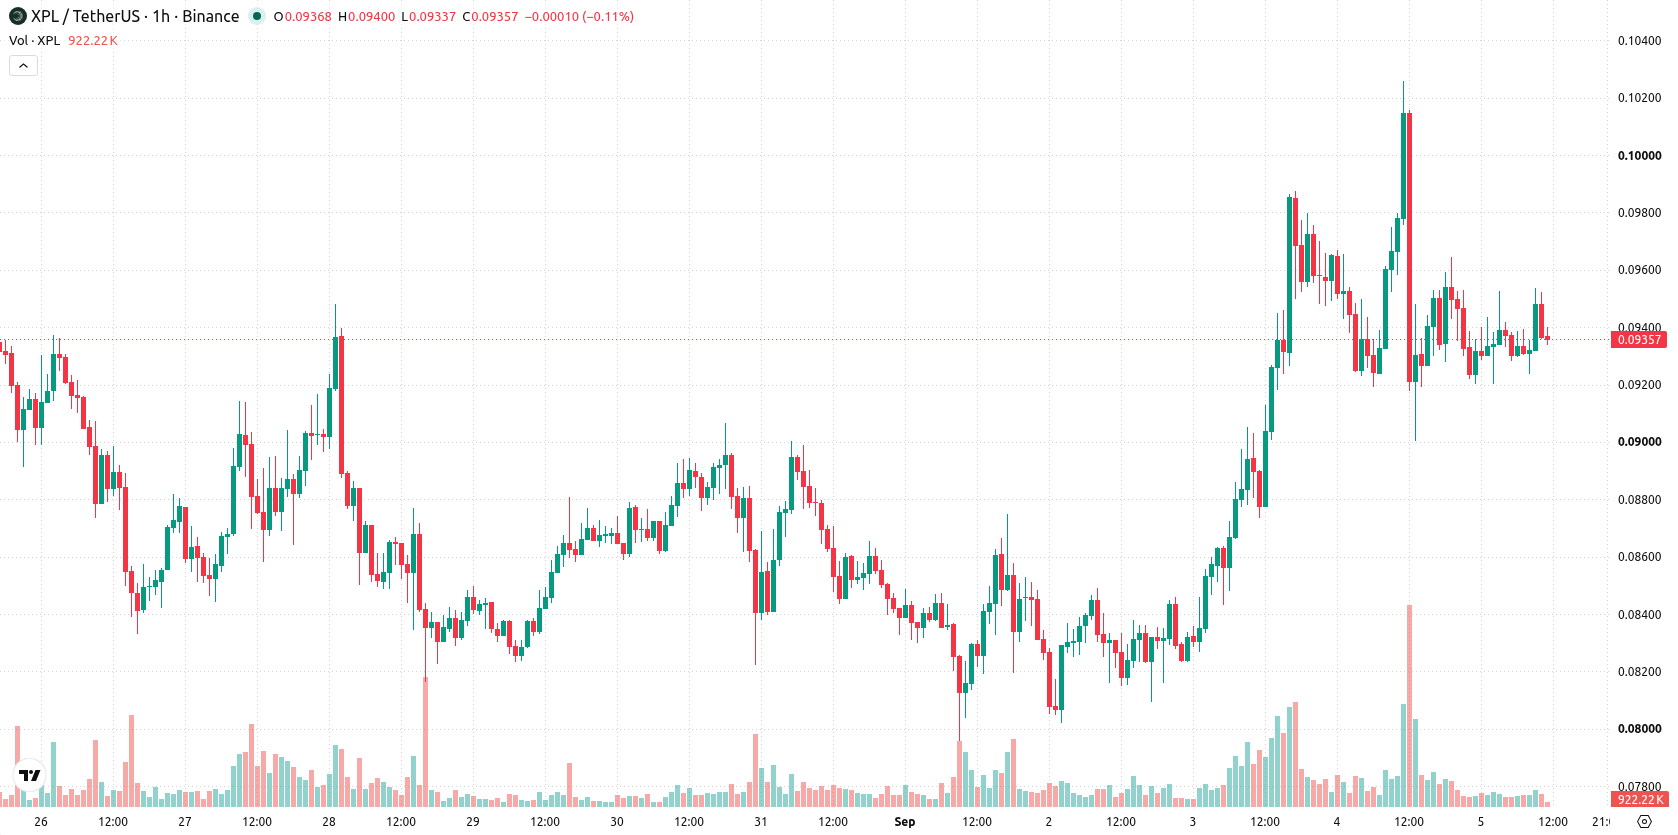
Plasma (XPL) is trading at $0.0935, marking a decline of 7.42% for the day. The asset sits below its short-, medium-, and long-term key moving averages, reflecting ongoing pressure across multiple timeframes.
 0.0894
0.0950
0.0894
0.0950
Highlights
- XPL/USD trades below key moving averages across intraday and daily charts, indicating persistent selling momentum at all timeframes.
- Mixed momentum indicators show intraday buyer activity and overbought conditions, but trend strength remains weak and direction is indecisive.
- Price is at $0.0935, down 7.42% intraday, with expected movement between $0.0884 to $0.0986 and a 56% probability of moving higher.
Momentum divergence amid elevated volatility and mid-range trade
On the technical front, XPL/USD is trading below the MA-20 and MA-50 on the H1 timeframe, and remains under the MA-200 on the daily chart. The Ichimoku Kijun at $0.0963 now serves as immediate resistance. Momentum signals are mixed: MACD and ADX are neutral, RSI and CCI show buy signals, and Bull/Bear Power supports intraday buyer dominance. However, Stochastic RSI points to overbought conditions, diverging from bullish momentum readings, while the Awesome Oscillator stays neutral. The spot price is mid-range with high volatility, which highlights an unsettled and indecisive market landscape.
Sideways price scenario as breakout risk remains elevated
Looking ahead to the next two to three trading days, the price is expected to range between $0.0884 and $0.0986. Current models indicate a higher probability of an upward move (56%) versus a downward move (44%). The baseline scenario projects sideways action between support and resistance; a bullish outcome would require a breakout above $0.0963, while a move below $0.0884 could quickly accelerate losses.
Earlier, analysts noted that Plasma (XPL) was demonstrating strong upside momentum despite a mixed long-term trend. The current analysis signals a shift toward a more indecisive market landscape, with traders now advised to monitor for a clear break above immediate resistance at $0.0963 to confirm renewed bullish potential.










-
 Afghanistan
-
 Albania
-
 Algeria
-
 Angola
-
 Argentina
-
 Armenia
-
 Australia
-
 Austria
-
 Azerbaijan
-
 Bahamas
-
 Bahrain
-
 Bangladesh
-
 Belarus
-
 Belgium
-
 Bolivia
-
 Botswana
-
 Brazil
-
 Brunei
-
 Bulgaria
-
 Cambodia
-
 Cameroon
-
 Canada
-
 Chile
Chile
-
 China
China
-
 Colombia
-
 Congo
Congo
-
 Costa Rica
-
 Cote d'Ivoire
-
 Croatia
-
 Cuba
Cuba
-
 Cyprus
-
 Czechia
-
 DR Congo
-
 Denmark
-
 Dominican Republic
-
 Ecuador
-
 Egypt
Egypt
-
 El Salvador
-
 Estonia
-
 Eswatini
-
 Ethiopia
-
 Finland
-
 France
-
 Georgia
-
 Germany
-
 Ghana
Ghana
-
 Greece
-
 Haiti
Haiti
-
 Hong Kong
-
 Hungary
-
 India
India
-
 Indonesia
-
 Iran, Islamic republic
-
 Iraq
Iraq
-
 Ireland
-
 Israel
-
 Italy
Italy
-
 Jamaica
-
 Japan
Japan
-
 Jordan
-
 Kazakhstan
-
 Kenya
Kenya
-
 Korea
Korea
-
 Kuwait
-
 Kyrgyzstan
-
 Laos
Laos
-
 Latvia
-
 Lebanon
-
 Lesotho
-
 Libya
Libya
-
 Lithuania
-
 Luxembourg
-
 Madagascar
-
 Malaysia
-
 Malta
Malta
-
 Mauritius
-
 Mexico
-
 Moldova
-
 Mongolia
-
 Montenegro
-
 Morocco
-
 Mozambique
-
 Myanmar
-
 Namibia
-
 Nepal
Nepal
-
 Netherlands
-
 New Zealand
-
 Nigeria
-
 North Macedonia
-
 Norway
-
 Oman
Oman
-
 Pakistan
-
 Palestine
-
 Panama
-
 Papua New Guinea
-
 Paraguay
-
 Peru
Peru
-
 Philippines
-
 Poland
-
 Portugal
-
 Puerto Rico
-
 Qatar
Qatar
-
 Reunion
-
 Romania
-
 Rwanda
-
 Saudi Arabia
-
 Serbia
-
 Singapore
-
 Slovakia
-
 Slovenia
-
 Somalia
-
 South Africa
-
 Spain
Spain
-
 Sri Lanka
-
 Sweden
-
 Switzerland
-
 Syria
Syria
-
 Taiwan
-
 Tajikistan
-
 Tanzania
-
 Thailand
-
 Trinidad and Tobago
-
 Tunisia
-
 Turkey
-
 UAE
UAE
-
 Uganda
-
 Ukraine
-
 United Kingdom
-
United States
-
 Uruguay
-
 Uzbekistan
-
 Venezuela
-
 Vietnam
-
 Yemen
Yemen
-
 Zambia
-
 Zimbabwe
- Forex
- Crypto












