


Floki (FLOKI) surged 9.73% on a strong wave of technical momentum, as buyers showed broad control across all key time frames. The advance is supported by the price moving above its 20-day, 50-day, and 200-day moving averages, confirming a bullish structure.
 0.0000214
0.00002346
Highlights
- FLOKI/USD trades above all key short-, medium-, and long-term moving averages, confirming broad-based bullish momentum across timeframes.
- Momentum indicators including MACD, ADX, Bull/Bear Power, and a 9.73% session gain support strong ongoing buying interest, with only the Stochastic RSI flagging potential near-term divergence.
- Projected price range over the next five trading days is $0.00002525 to $0.00002906, with over 80% probability of an upward move if resistance at $0.00002906 is breached.
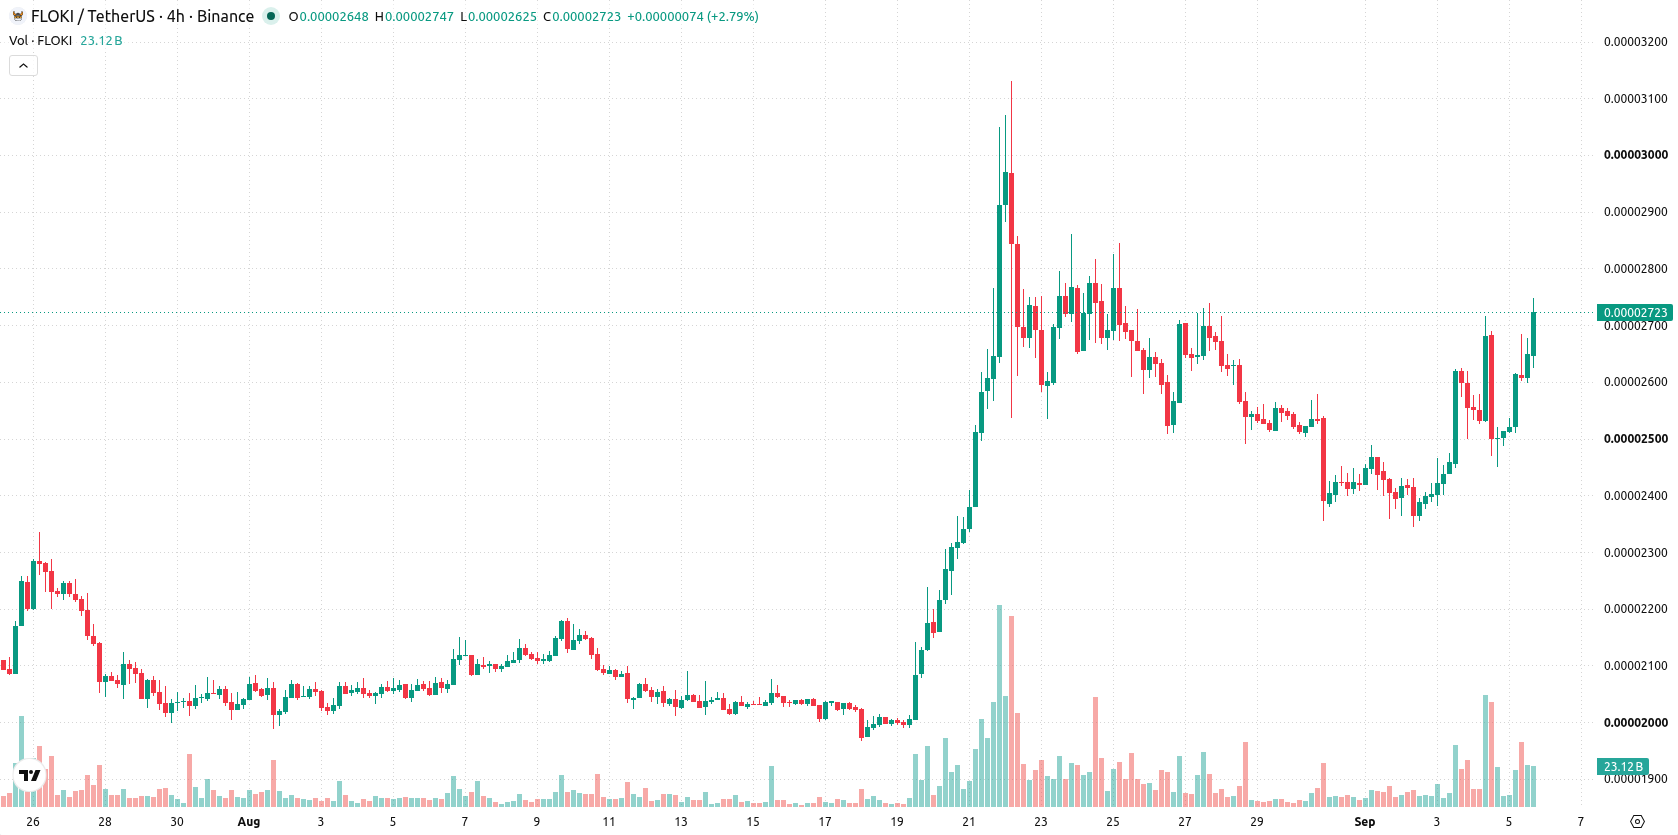
Bullish structure as momentum indicators reinforce support levels
FLOKI/USD trades above the 20-day, 50-day, and 200-day moving averages, with current price at $0.0000272 versus MA-20 at $0.00002468, MA-50 at $0.00002242, and MA-200 at $0.0000268. This alignment confirms short-, medium-, and long-term bullish momentum, though the MA-50 vs MA-200 alignment remains bearish. Near-term support is at $0.00002716 and resistance at $0.00002906. Momentum remains solid as the MACD and ADX both forecast further buying interest. The RSI stays in neutral territory with a buy signal, and Stochastic RSI indicates the pair is oversold. The CCI is neutral, and BBP is firmly positive, confirming buyers dominate the intraday session. The pair opened with an upside gap of around 1.21% and $0.0000003 and trades near the daily high. Intraday volatility is 6.77%. FLOKI/USD is up $0.0000024 or 9.73% since the previous session, with strength confirmed by momentum readings, even as the oversold Stochastic RSI points to some divergence.
Earlier, analysts noted that Floki was exhibiting strong bullish momentum supported by favorable technical alignment. The latest price action and indicator readings reinforce this outlook, and a sustained move above $0.00002906 would signal the next breakout to monitor.










-
 Afghanistan
-
 Albania
-
 Algeria
-
 Angola
-
 Argentina
-
 Armenia
-
 Australia
-
 Austria
-
 Azerbaijan
-
 Bahamas
-
 Bahrain
-
 Bangladesh
-
 Belarus
-
 Belgium
-
 Bolivia
-
 Botswana
-
 Brazil
-
 Brunei
-
 Bulgaria
-
 Cambodia
-
 Cameroon
-
 Canada
-
 Chile
-
 China
-
 Colombia
-
 Congo
-
 Costa Rica
-
 Cote d'Ivoire
-
 Croatia
-
 Cuba
-
 Cyprus
-
 Czechia
-
 DR Congo
-
 Denmark
-
 Dominican Republic
-
 Ecuador
-
 Egypt
-
 El Salvador
-
 Estonia
-
 Eswatini
-
 Ethiopia
-
 Finland
-
 France
-
 Georgia
-
 Germany
-
 Ghana
-
 Greece
-
 Haiti
-
 Hong Kong
-
 Hungary
-
 India
-
 Indonesia
-
 Iran, Islamic republic
-
 Iraq
-
 Ireland
-
 Israel
-
 Italy
-
 Jamaica
-
 Japan
-
 Jordan
-
 Kazakhstan
-
 Kenya
-
 Korea
-
 Kuwait
-
 Kyrgyzstan
-
 Laos
-
 Latvia
-
 Lebanon
-
 Lesotho
-
 Libya
-
 Lithuania
-
 Luxembourg
-
 Madagascar
-
 Malaysia
-
 Malta
-
 Mauritius
-
 Mexico
-
 Moldova
-
 Mongolia
-
 Montenegro
-
 Morocco
-
 Mozambique
-
 Myanmar
-
 Namibia
-
 Nepal
-
 Netherlands
-
 New Zealand
-
 Nigeria
-
 North Macedonia
-
 Norway
-
 Oman
-
 Pakistan
-
 Palestine
-
 Panama
-
 Papua New Guinea
-
 Paraguay
-
 Peru
-
 Philippines
-
 Poland
-
 Portugal
-
 Puerto Rico
-
 Qatar
-
 Reunion
-
 Romania
-
 Rwanda
-
 Saudi Arabia
-
 Serbia
-
 Singapore
-
 Slovakia
-
 Slovenia
-
 Somalia
-
 South Africa
-
 Spain
-
 Sri Lanka
-
 Sweden
-
 Switzerland
-
 Syria
-
 Taiwan
-
 Tajikistan
-
 Tanzania
-
 Thailand
-
 Trinidad and Tobago
-
 Tunisia
-
 Turkey
-
 UAE
-
 Uganda
-
 Ukraine
-
 United Kingdom
-
United States
-
 Uruguay
-
 Uzbekistan
-
 Venezuela
-
 Vietnam
-
 Yemen
-
 Zambia
-
 Zimbabwe
- Forex
- Crypto












