

Why is Bitcoin flat today? Spot ETF inflows and $81,335 resistance levels in focus

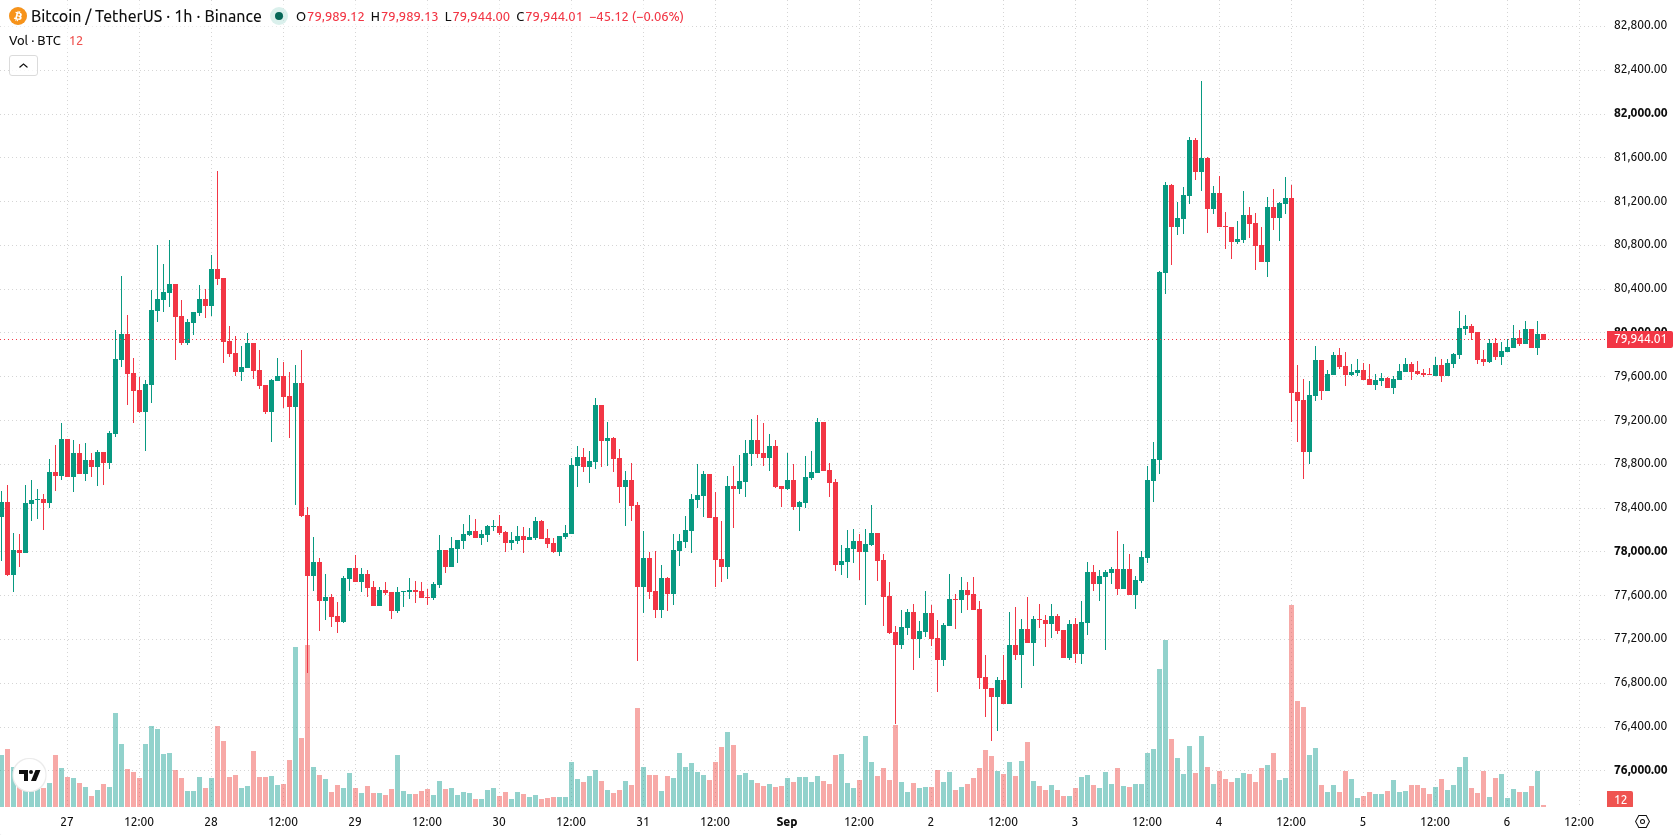
Bitcoin (BTC) is trading at $79,986 after a modest move higher on the day, with daily gains under 1%. The asset currently sits above its key short-term and medium-term moving averages, reflecting a stable price foundation.
 82917.62
84168.00
Highlights
- BlackRock's iShares Bitcoin Trust attracted $117.4 million in inflows on September 4, 2026, as institutional investments intensified in spot Bitcoin ETFs.
- Spot Bitcoin ETFs in the U.S. received $731 million in net inflows on the previous day, with BlackRock's IBIT capturing $454 million and leading sustained allocations.
- BTC/USD is trading with a short-term and medium-term bullish bias and is expected to remain in a $78,636 to $81,335 range over the next 2 to 3 days, with momentum indicators diverging but upward movement more likely.
Institutional inflows surge as BlackRock ETF leads spot allocations
BlackRock's iShares Bitcoin Trust (IBIT) recorded $117.4 million in inflows on September 4, 2026, representing a fresh wave of institutional funds moving into physically-backed Bitcoin investment products, according to Archyde. This activity follows data from Coinstats showing that spot Bitcoin ETFs in the U.S. registered approximately $731 million in net inflows just a day earlier, with BlackRock's IBIT capturing a significant $454 million share. Additional figures from Coinfomania indicate that spot Bitcoin ETFs have continued to attract robust institutional allocations in recent periods, led by BlackRock, supporting steady access to liquidity and broadening mainstream adoption.
Mixed momentum signals as indicators diverge within technical range
On the technical front, BTC/USD is trading above both its MA-20 and MA-50 on the hourly chart and remains well above the daily MA-200. The Ichimoku Kijun sits at $79,821, offering immediate support. Momentum indicators are mixed: MACD flashes a buy signal, ADX remains neutral, while Stochastic RSI points to a strong sell. CCI and RSI readings are bullish, and both Bull/Bear Power and the Awesome Oscillator support ongoing buyer dominance. Intraday price action is contained within a mid-range on low volatility, with indicator divergence signaling uncertainty in momentum.
Limited range expected as odds tilt slightly toward breakout
Looking ahead over the next two to three trading days, BTC/USD is likely to consolidate within a $78,636 to $81,335 range, reflecting typical volatility bands seen at current levels. Probabilities slightly favor an upward extension, with a 62% chance of an upward breakout, but a sideways outcome remains the baseline scenario. A decisive move above $81,335 would mark further bullish momentum, while a slip below $78,636 could open the way for a short-term correction.
Earlier, analysts noted that Bitcoin was demonstrating resilient bullish momentum amid persistent investor demand and growing institutional inflows, though with some uncertainty in short-term indicators. The current data reinforces this outlook, with continued strong ETF inflows supporting a consolidation bias and highlighting $81,335 as the next critical resistance level to monitor for a potential breakout.










-
 Afghanistan
-
 Albania
-
 Algeria
-
 Angola
-
 Argentina
-
 Armenia
-
 Australia
-
 Austria
-
 Azerbaijan
-
 Bahamas
-
 Bahrain
-
 Bangladesh
-
 Belarus
-
 Belgium
-
 Bolivia
-
 Botswana
-
 Brazil
-
 Brunei
-
 Bulgaria
-
 Cambodia
-
 Cameroon
-
 Canada
-
 Chile
-
 China
-
 Colombia
-
 Congo
-
 Costa Rica
-
 Cote d'Ivoire
-
 Croatia
-
 Cuba
-
 Cyprus
-
 Czechia
-
 DR Congo
-
 Denmark
-
 Dominican Republic
-
 Ecuador
-
 Egypt
-
 El Salvador
-
 Estonia
-
 Eswatini
-
 Ethiopia
-
 Finland
-
 France
-
 Georgia
-
 Germany
-
 Ghana
-
 Greece
-
 Haiti
-
 Hong Kong
-
 Hungary
-
 India
-
 Indonesia
-
 Iran, Islamic republic
-
 Iraq
-
 Ireland
-
 Israel
-
 Italy
-
 Jamaica
-
 Japan
-
 Jordan
-
 Kazakhstan
-
 Kenya
-
 Korea
-
 Kuwait
-
 Kyrgyzstan
-
 Laos
-
 Latvia
-
 Lebanon
-
 Lesotho
-
 Libya
-
 Lithuania
-
 Luxembourg
-
 Madagascar
-
 Malaysia
-
 Malta
-
 Mauritius
-
 Mexico
-
 Moldova
-
 Mongolia
-
 Montenegro
-
 Morocco
-
 Mozambique
-
 Myanmar
-
 Namibia
-
 Nepal
-
 Netherlands
-
 New Zealand
-
 Nigeria
-
 North Macedonia
-
 Norway
-
 Oman
-
 Pakistan
-
 Palestine
-
 Panama
-
 Papua New Guinea
-
 Paraguay
-
 Peru
-
 Philippines
-
 Poland
-
 Portugal
-
 Puerto Rico
-
 Qatar
-
 Reunion
-
 Romania
-
 Rwanda
-
 Saudi Arabia
-
 Serbia
-
 Singapore
-
 Slovakia
-
 Slovenia
-
 Somalia
-
 South Africa
-
 Spain
-
 Sri Lanka
-
 Sweden
-
 Switzerland
-
 Syria
-
 Taiwan
-
 Tajikistan
-
 Tanzania
-
 Thailand
-
 Trinidad and Tobago
-
 Tunisia
-
 Turkey
-
 UAE
-
 Uganda
-
 Ukraine
-
 United Kingdom
-
United States
-
 Uruguay
-
 Uzbekistan
-
 Venezuela
-
 Vietnam
-
 Yemen
-
 Zambia
-
 Zimbabwe
- Forex
- Crypto












