

The Graph buyers push higher but momentum looks stretched: weekly analysis

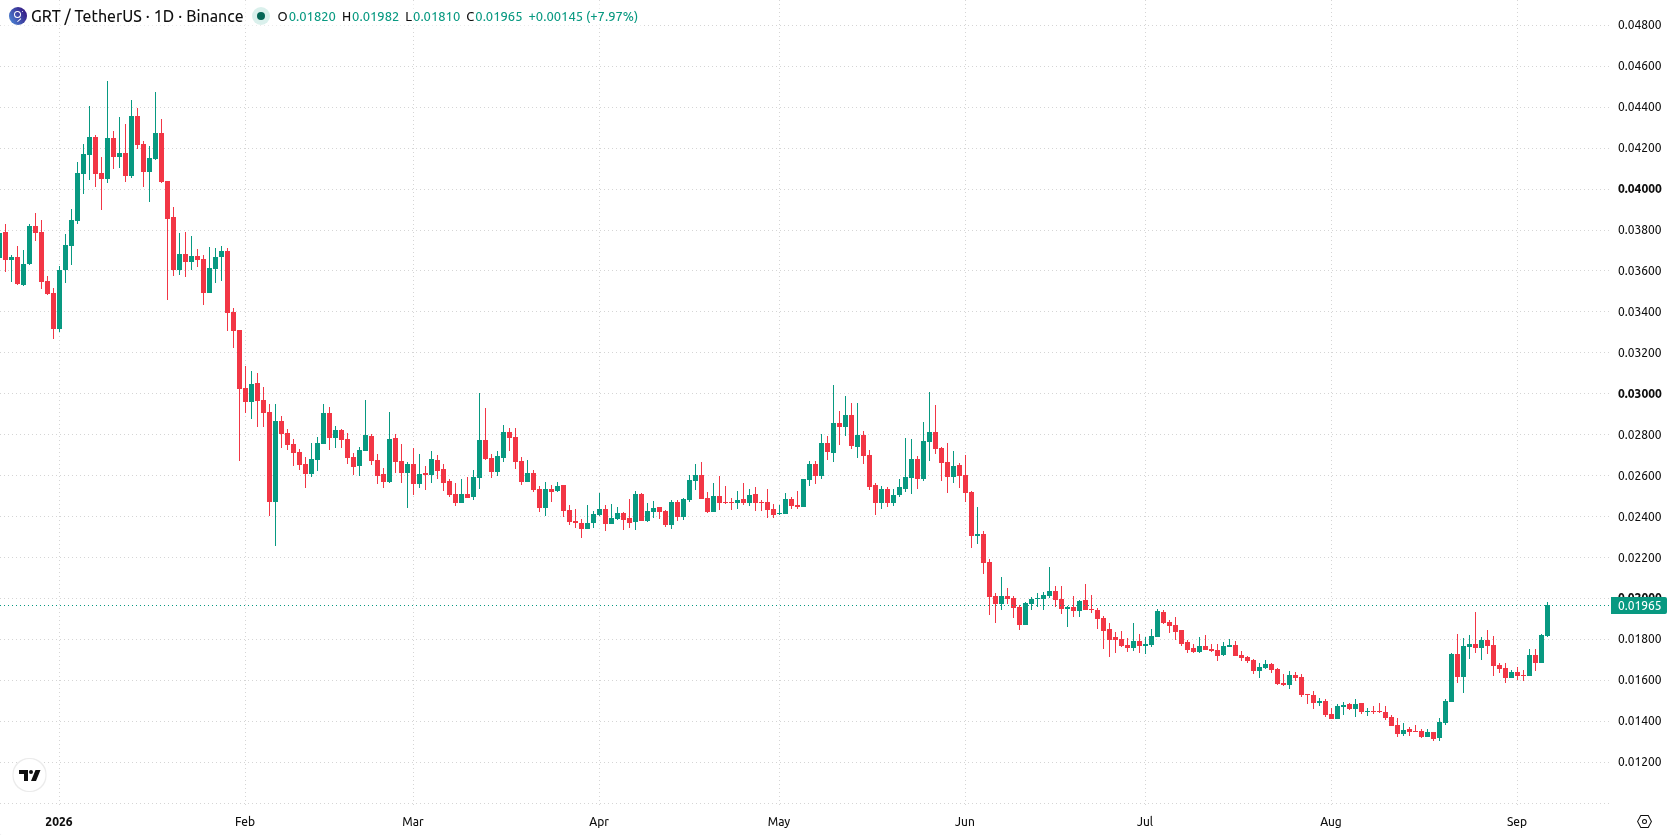
The Graph (GRT) is pushing higher, trading around $0.01966 after gaining more than 19% over the past week. Buyers remain firmly in control, but the surge has left momentum indicators looking stretched, raising caution about sustainability. Traders will be watching whether this bullish energy continues or starts to falter in the coming days.
 0.02554
0.02922000
0.02554
0.02922000
Highlights
- The Graph rose 19.09% this week to $0.01966, closing at the top of its weekly trading range.
- Short-term momentum is strong with an established uptrend and technical buy signals, but long-term structure remains bearish below the 200-day average.
- Next week, price is projected to trade between $0.01756 and $0.02089292 with a strong probability of continued gains unless support at $0.01825 breaks.
Uptrend accelerates as MACD and ADX signal buy with rising volatility
The daily chart reveals an uptrend, highlighted by a sustained move higher with a firm trend and 14.64% volatility over the week. Both the MACD and ADX are in buy mode, confirming strong upward momentum, while the RSI at 61.74187454 is approaching the overbought zone. Immediate support sits at $0.01825, with the next resistance at the 200-day average of $0.02155555. The setup favors continuation higher as long as support holds.
Bullish bias persists into next week as breakout risk centers on resistance
Next week, the expected range is $0.01756 to $0.02089292, with a very high probability of an increase and a very low probability of a decrease. The base case is for price action to continue oscillating within this range. A close above $0.02155555 would open a bullish extension, while a fallback below $0.01825 would shift risk to the downside.
Earlier, analysts noted that The Graph was consolidating within a defined range with balanced yet cautious momentum. The current breakout above that range marks a significant change in trend, making sustainability of the push above immediate support a critical risk to monitor in the near term.











-
 Afghanistan
-
 Albania
-
 Algeria
-
 Angola
-
 Argentina
-
 Armenia
-
 Australia
-
 Austria
-
 Azerbaijan
-
 Bahamas
-
 Bahrain
-
 Bangladesh
-
 Belarus
-
 Belgium
-
 Bolivia
-
 Botswana
-
 Brazil
-
 Brunei
-
 Bulgaria
-
 Cambodia
-
 Cameroon
-
 Canada
-
 Chile
Chile
-
 China
China
-
 Colombia
-
 Congo
Congo
-
 Costa Rica
-
 Cote d'Ivoire
-
 Croatia
-
 Cuba
Cuba
-
 Cyprus
-
 Czechia
-
 DR Congo
-
 Denmark
-
 Dominican Republic
-
 Ecuador
-
 Egypt
Egypt
-
 El Salvador
-
 Estonia
-
 Eswatini
-
 Ethiopia
-
 Finland
-
 France
-
 Georgia
-
 Germany
-
 Ghana
Ghana
-
 Greece
-
 Haiti
Haiti
-
 Hong Kong
-
 Hungary
-
 India
India
-
 Indonesia
-
 Iran, Islamic republic
-
 Iraq
Iraq
-
 Ireland
-
 Israel
-
 Italy
Italy
-
 Jamaica
-
 Japan
Japan
-
 Jordan
-
 Kazakhstan
-
 Kenya
Kenya
-
 Korea
Korea
-
 Kuwait
-
 Kyrgyzstan
-
 Laos
Laos
-
 Latvia
-
 Lebanon
-
 Lesotho
-
 Libya
Libya
-
 Lithuania
-
 Luxembourg
-
 Madagascar
-
 Malaysia
-
 Malta
Malta
-
 Mauritius
-
 Mexico
-
 Moldova
-
 Mongolia
-
 Montenegro
-
 Morocco
-
 Mozambique
-
 Myanmar
-
 Namibia
-
 Nepal
Nepal
-
 Netherlands
-
 New Zealand
-
 Nigeria
-
 North Macedonia
-
 Norway
-
 Oman
Oman
-
 Pakistan
-
 Palestine
-
 Panama
-
 Papua New Guinea
-
 Paraguay
-
 Peru
Peru
-
 Philippines
-
 Poland
-
 Portugal
-
 Puerto Rico
-
 Qatar
Qatar
-
 Reunion
-
 Romania
-
 Rwanda
-
 Saudi Arabia
-
 Serbia
-
 Singapore
-
 Slovakia
-
 Slovenia
-
 Somalia
-
 South Africa
-
 Spain
Spain
-
 Sri Lanka
-
 Sweden
-
 Switzerland
-
 Syria
Syria
-
 Taiwan
-
 Tajikistan
-
 Tanzania
-
 Thailand
-
 Trinidad and Tobago
-
 Tunisia
-
 Turkey
-
 UAE
UAE
-
 Uganda
-
 Ukraine
-
 United Kingdom
-
United States
-
 Uruguay
-
 Uzbekistan
-
 Venezuela
-
 Vietnam
-
 Yemen
Yemen
-
 Zambia
-
 Zimbabwe
- Forex
- Crypto












