

Raydium price forecast: LaunchLab supports all Solana token pairs, fueling rebound

Raydium (RAY) is trading at $1.197, marking a daily gain of 12.42%. The asset has climbed above its medium- and long-term moving averages, though it is currently encountering resistance at key short-term averages.
 1.8858
2.1904
Highlights
- Raydium trading volume exceeded $31.8 million after the StonkFun launchpad integration, increasing liquidity and visibility for the RAY token.
- Raydium allocates 12% of trading fees to a token buyback program that reduces RAY supply, and LaunchLab will support all Solana pairs by September 7, 2026.
- RAY/USD is projected to consolidate in the $1.05 to $1.344 range, with mixed momentum signals and a 64% probability of further upside.
Trading volume surges as launchpad integration and buybacks fuel demand
Raydium has registered a substantial boost in trading volume, surpassing $31.8 million following the integration of the StonkFun launchpad, bringing heightened liquidity and enhanced visibility to the RAY token, according to Kucoin. This integration has attracted notable market participation, reflecting strong demand related to new project onboarding. Additionally, Raydium's ongoing token buyback program, which channels 12% of trading fees into repurchasing RAY, continues to reduce circulating supply, while the September 7, 2026 expansion of LaunchLab to support all Solana token pairs—introduced with StonkFun as launch partner, per Crypto—broadens platform appeal and could further increase transaction flows.
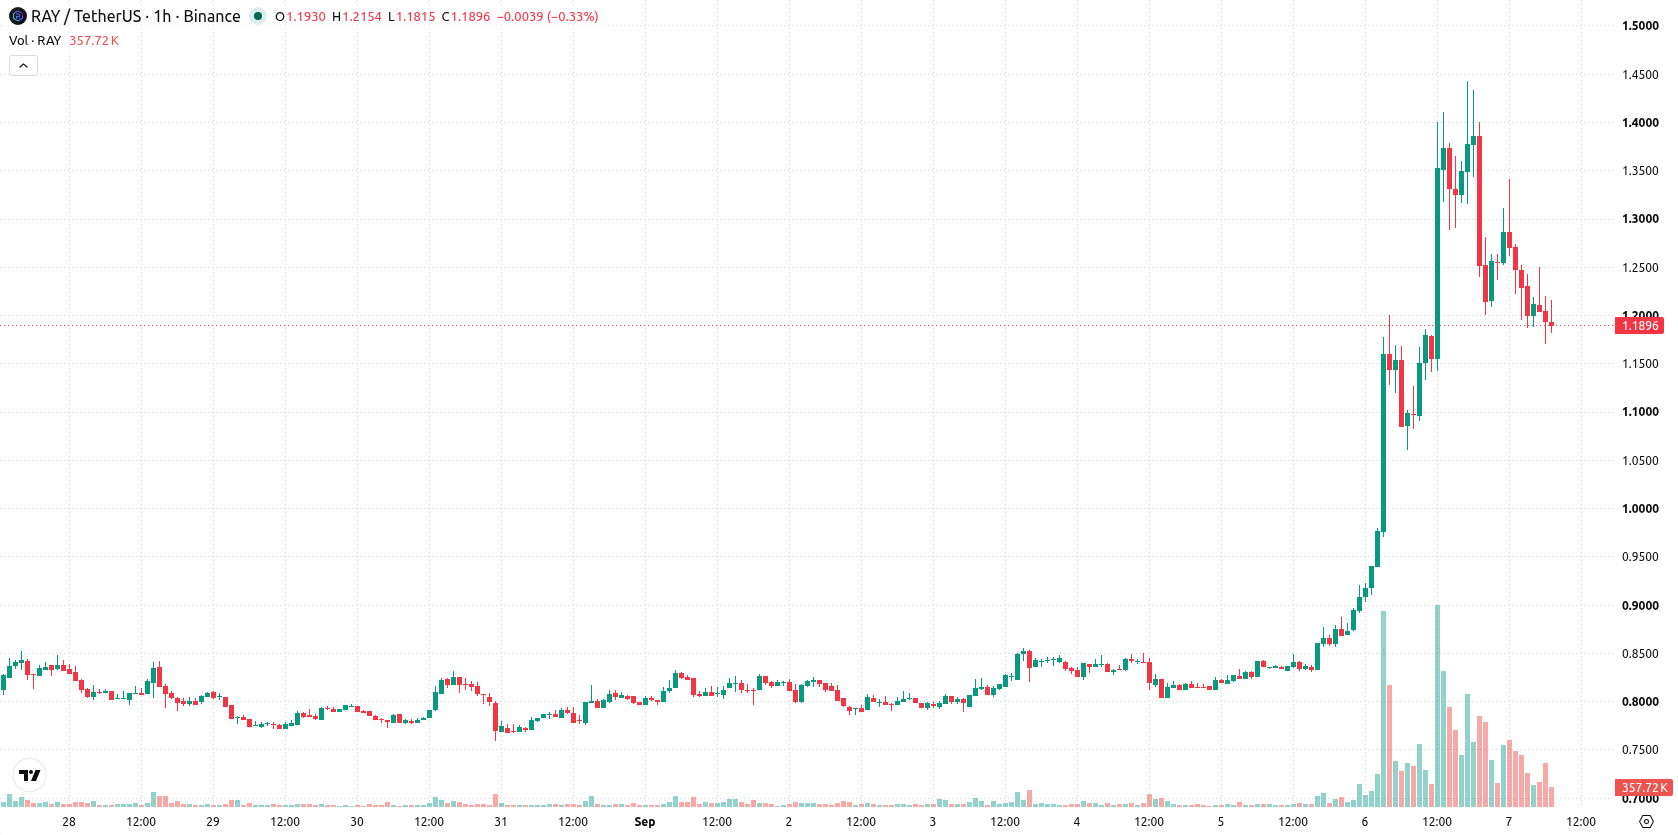
Mixed momentum signals as intraday weakness counters trend support
Technically, RAY is finding immediate resistance at the Ichimoku Kijun level of $1.2514. The asset remains above the MA-50 and MA-200, which serve as key support levels, while trading below the MA-20 suggests near-term hesitation. Momentum indicators are mixed: MACD signals Strong Buy and ADX indicates a supportive trend, while oscillators diverge—RSI registers 52 (Buy), Stochastic RSI is in the oversold territory, and CCI points to Sell. Bull/Bear Power confirms seller dominance as the price closed near today's low. The Awesome Oscillator reads Neutral, highlighting a divergence between strong momentum and faltering intraday demand.
Upside potential dominates as volatility and key levels shape outlook
Over the next two to three trading days, the anticipated price range is between $1.05 and $1.344, reflecting typical volatility for the asset. The probability of an upside move is estimated at 64%, suggesting further gains are more likely than a reversal. A close above $1.2514 could reawaken bullish momentum, while a breakdown below $1.05 would heighten downside risk and likely attract additional selling.
Earlier, analysts noted that Raydium was exhibiting sustained bullish momentum supported by ecosystem expansion and strong technical indicators. The current technical setup introduces mixed signals, so traders should closely monitor price action near the $1.2514 resistance to anticipate either a continued upward move or an increased risk of short-term reversal.





Latest Raydium News


-
 Afghanistan
-
 Albania
-
 Algeria
-
 Angola
-
 Argentina
-
 Armenia
-
 Australia
-
 Austria
-
 Azerbaijan
-
 Bahamas
-
 Bahrain
-
 Bangladesh
-
 Belarus
-
 Belgium
-
 Bolivia
-
 Botswana
-
 Brazil
-
 Brunei
-
 Bulgaria
-
 Cambodia
-
 Cameroon
-
 Canada
-
 Chile
-
 China
-
 Colombia
-
 Congo
-
 Costa Rica
-
 Cote d'Ivoire
-
 Croatia
-
 Cuba
-
 Cyprus
-
 Czechia
-
 DR Congo
-
 Denmark
-
 Dominican Republic
-
 Ecuador
-
 Egypt
-
 El Salvador
-
 Estonia
-
 Eswatini
-
 Ethiopia
-
 Finland
-
 France
-
 Georgia
-
 Germany
-
 Ghana
-
 Greece
-
 Haiti
-
 Hong Kong
-
 Hungary
-
 India
-
 Indonesia
-
 Iran, Islamic republic
-
 Iraq
-
 Ireland
-
 Israel
-
 Italy
-
 Jamaica
-
 Japan
-
 Jordan
-
 Kazakhstan
-
 Kenya
-
 Korea
-
 Kuwait
-
 Kyrgyzstan
-
 Laos
-
 Latvia
-
 Lebanon
-
 Lesotho
-
 Libya
-
 Lithuania
-
 Luxembourg
-
 Madagascar
-
 Malaysia
-
 Malta
-
 Mauritius
-
 Mexico
-
 Moldova
-
 Mongolia
-
 Montenegro
-
 Morocco
-
 Mozambique
-
 Myanmar
-
 Namibia
-
 Nepal
-
 Netherlands
-
 New Zealand
-
 Nigeria
-
 North Macedonia
-
 Norway
-
 Oman
-
 Pakistan
-
 Palestine
-
 Panama
-
 Papua New Guinea
-
 Paraguay
-
 Peru
-
 Philippines
-
 Poland
-
 Portugal
-
 Puerto Rico
-
 Qatar
-
 Reunion
-
 Romania
-
 Rwanda
-
 Saudi Arabia
-
 Serbia
-
 Singapore
-
 Slovakia
-
 Slovenia
-
 Somalia
-
 South Africa
-
 Spain
-
 Sri Lanka
-
 Sweden
-
 Switzerland
-
 Syria
-
 Taiwan
-
 Tajikistan
-
 Tanzania
-
 Thailand
-
 Trinidad and Tobago
-
 Tunisia
-
 Turkey
-
 UAE
-
 Uganda
-
 Ukraine
-
 United Kingdom
-
United States
-
 Uruguay
-
 Uzbekistan
-
 Venezuela
-
 Vietnam
-
 Yemen
-
 Zambia
-
 Zimbabwe
- Forex
- Crypto












