

What's behind Raydium's latest 9.9% price pullback?

Raydium (RAY) slid 9.91% after an initial gap lower, even as recent platform upgrades and record daily revenue following the StonkFun integration marked a period of strong fundamental activity. The pullback is limited by the token’s continued bullish alignment above its major moving averages.
 1.7866
1.8180
Highlights
- Raydium upgraded LaunchLab to enable any token pairings and saw daily revenue climb to $440,000, the highest since July 2025.
- Recent buybacks and increased staked supply substantially reduced circulating RAY tokens, and platform changes aimed to boost liquidity and lower fees.
- RAY trades above key averages with bulls in control, but intraday losses and overbought signals cap conviction as the projected five-day range is $0.8632 to $1.7102.
Supply reduction and record revenue offset by persistent selling pressure
Raydium upgraded its LaunchLab feature to support any token pairings, moving away from fixed-quote structures. Daily revenue surged to approximately $440,000 following the integration of StonkFun’s platform, which was the highest level since July 2025. Recent buybacks and increases in staked supply greatly reduced circulating RAY tokens, accompanied by platform changes intended to improve liquidity and reduce fees, though price action has remained under broader selling pressure.
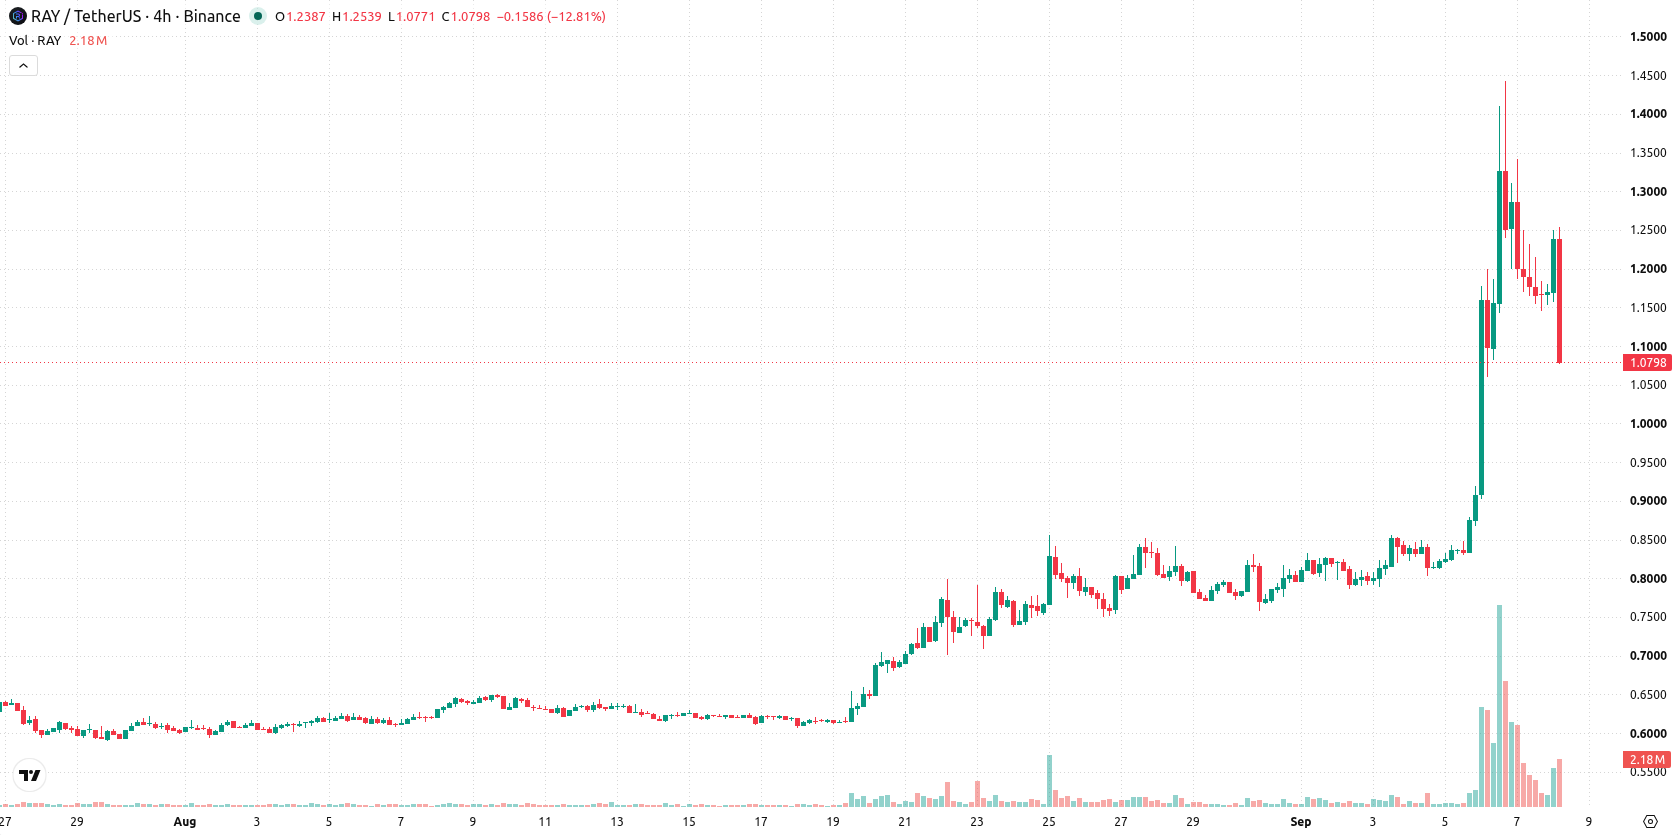
Bullish trend persists despite overbought signals and intraday volatility
RAY/USD is positioned above its 20-day, 50-day, and 200-day moving averages, at $0.8296, $0.7085, and $0.676 respectively, signaling sustained bullish momentum across all timeframes. The near-term range is defined by resistance at $1.0802 and support at $1.0246, with ongoing strength as the 50-day average remains above the 200-day. Momentum indicators are mixed: the MACD and ADX continue to favor bulls, but the RSI at 74.6005 and CCI at 312.659 show overbought conditions. Stochastic RSI signals a strong sell, underscoring a divergence among oscillators. Bull/Bear Power is positive at 0.4261, and the Awesome Oscillator maintains a bullish tone. However, RAY/USD is currently down $0.1187 and close to its daily low after a gap lower, with intraday volatility at 16.08%. This reflects short-term selling pressure in an otherwise bullish trend.
In a recent review, analysts highlighted that Raydium was shifting to a more neutral technical stance despite strong platform upgrades and increased activity. The current article strengthens this outlook with fresh evidence of robust fundamentals and mixed momentum signals, suggesting traders should monitor for a potential breakout above $1.0802 as the next catalyst for directional movement.






Latest Raydium News




-
 Afghanistan
-
 Albania
-
 Algeria
-
 Angola
-
 Argentina
-
 Armenia
-
 Australia
-
 Austria
-
 Azerbaijan
-
 Bahamas
-
 Bahrain
-
 Bangladesh
-
 Belarus
-
 Belgium
-
 Bolivia
-
 Botswana
-
 Brazil
-
 Brunei
-
 Bulgaria
-
 Cambodia
-
 Cameroon
-
 Canada
-
 Chile
-
 China
-
 Colombia
-
 Congo
-
 Costa Rica
-
 Cote d'Ivoire
-
 Croatia
-
 Cuba
-
 Cyprus
-
 Czechia
-
 DR Congo
-
 Denmark
-
 Dominican Republic
-
 Ecuador
-
 Egypt
-
 El Salvador
-
 Estonia
-
 Eswatini
-
 Ethiopia
-
 Finland
-
 France
-
 Georgia
-
 Germany
-
 Ghana
-
 Greece
-
 Haiti
-
 Hong Kong
-
 Hungary
-
 India
-
 Indonesia
-
 Iran, Islamic republic
-
 Iraq
-
 Ireland
-
 Israel
-
 Italy
-
 Jamaica
-
 Japan
-
 Jordan
-
 Kazakhstan
-
 Kenya
-
 Korea
-
 Kuwait
-
 Kyrgyzstan
-
 Laos
-
 Latvia
-
 Lebanon
-
 Lesotho
-
 Libya
-
 Lithuania
-
 Luxembourg
-
 Madagascar
-
 Malaysia
-
 Malta
-
 Mauritius
-
 Mexico
-
 Moldova
-
 Mongolia
-
 Montenegro
-
 Morocco
-
 Mozambique
-
 Myanmar
-
 Namibia
-
 Nepal
-
 Netherlands
-
 New Zealand
-
 Nigeria
-
 North Macedonia
-
 Norway
-
 Oman
-
 Pakistan
-
 Palestine
-
 Panama
-
 Papua New Guinea
-
 Paraguay
-
 Peru
-
 Philippines
-
 Poland
-
 Portugal
-
 Puerto Rico
-
 Qatar
-
 Reunion
-
 Romania
-
 Rwanda
-
 Saudi Arabia
-
 Serbia
-
 Singapore
-
 Slovakia
-
 Slovenia
-
 Somalia
-
 South Africa
-
 Spain
-
 Sri Lanka
-
 Sweden
-
 Switzerland
-
 Syria
-
 Taiwan
-
 Tajikistan
-
 Tanzania
-
 Thailand
-
 Trinidad and Tobago
-
 Tunisia
-
 Turkey
-
 UAE
-
 Uganda
-
 Ukraine
-
 United Kingdom
-
United States
-
 Uruguay
-
 Uzbekistan
-
 Venezuela
-
 Vietnam
-
 Yemen
-
 Zambia
-
 Zimbabwe
- Forex
- Crypto












