

Support test: Can Polygon hold $0.0891 and avoid deeper losses?

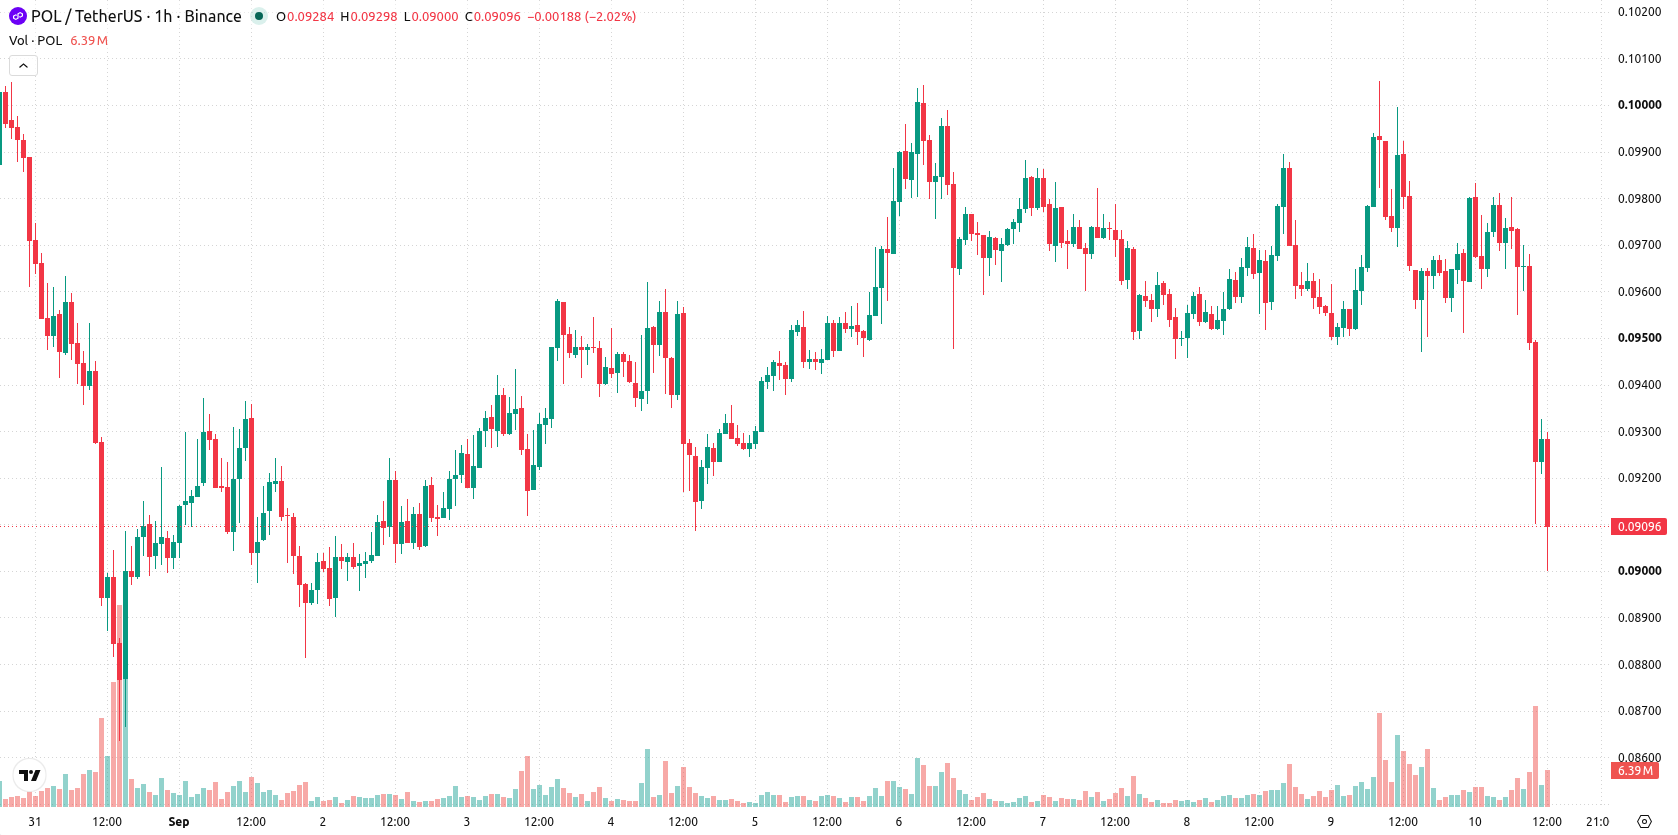
Polygon (POL) is trading at $0.0912, down 7.06% on the day. The asset is currently below its principal short- and medium-term moving averages, while still holding above its long-term trend level.
 0.0907
0.1001
Highlights
- Polygon trading volumes have consistently exceeded the 30-day average, indicating substantial participation and elevated liquidity in recent sessions.
- Persistent high-volume activity has not yet prevented continued selling pressure, with prices under broader downside forces despite market engagement.
- POL/USD trades below key short- and medium-term moving averages, with bearish momentum signals and a projected range of $0.0891 to $0.0936 for the next 2 to 3 days.
Elevated trading volumes drive liquidity amid persistent selling pressure
Polygon has experienced notable trading activity, with volumes consistently surpassing the 30-day average as reported by Diariobitcoin. Elevated trading volume reflects a heightened level of market participation and provides the liquidity necessary for the pronounced price swings seen in recent sessions. Further episodes of strong volume, including on September 9, underscore continued engagement from participants, though price action has remained under broader selling pressure.
Downside bias sustained as oscillators flag oversold and volatility spikes
Turning to technical factors, POL/USD is trading below its MA-20 and MA-50, reflecting persistent short- and medium-term downside pressure, while it remains above the MA-200. Immediate resistance is defined by the Ichimoku Kijun at $0.0955. Both MACD and RSI signal a sell bias, and ADX suggests neutral trend strength. Momentum readings—including RSI, Stoch RSI, and CCI—indicate oversold conditions, while Bull/Bear Power points to seller dominance in the intraday session. Awesome Oscillator is also aligned with the current downtrend, and recent price action sits near the daily low amid high volatility, with little to no intraday gap observed.
Range-bound outlook likely as upside breakout remains improbable
For the next two to three trading days, POL/USD is expected to consolidate within the range of $0.0891 to $0.0936, with a very low probability of an immediate upward move and a high likelihood of continued decline. The baseline scenario anticipates sideways action inside this volatility band. A break above the $0.0955 resistance would be needed to shift momentum toward a bullish scenario, while a decisive move below $0.0891 would reinforce the bearish outlook in the near term.
Previously it was reported that Polygon had established a firm upward momentum supported by protocol improvements and strong fundamentals. The current technical outlook now signals a shift to downside pressure, with traders advised to monitor $0.0891 as the critical support level that could define near-term risk.











-
 Afghanistan
-
 Albania
-
 Algeria
-
 Angola
-
 Argentina
-
 Armenia
-
 Australia
-
 Austria
-
 Azerbaijan
-
 Bahamas
-
 Bahrain
-
 Bangladesh
-
 Belarus
-
 Belgium
-
 Bolivia
-
 Botswana
-
 Brazil
-
 Brunei
-
 Bulgaria
-
 Cambodia
-
 Cameroon
-
 Canada
-
 Chile
-
 China
-
 Colombia
-
 Congo
-
 Costa Rica
-
 Cote d'Ivoire
-
 Croatia
-
 Cuba
-
 Cyprus
-
 Czechia
-
 DR Congo
-
 Denmark
-
 Dominican Republic
-
 Ecuador
-
 Egypt
-
 El Salvador
-
 Estonia
-
 Eswatini
-
 Ethiopia
-
 Finland
-
 France
-
 Georgia
-
 Germany
-
 Ghana
-
 Greece
-
 Haiti
-
 Hong Kong
-
 Hungary
-
 India
-
 Indonesia
-
 Iran, Islamic republic
-
 Iraq
-
 Ireland
-
 Israel
-
 Italy
-
 Jamaica
-
 Japan
-
 Jordan
-
 Kazakhstan
-
 Kenya
-
 Korea
-
 Kuwait
-
 Kyrgyzstan
-
 Laos
-
 Latvia
-
 Lebanon
-
 Lesotho
-
 Libya
-
 Lithuania
-
 Luxembourg
-
 Madagascar
-
 Malaysia
-
 Malta
-
 Mauritius
-
 Mexico
-
 Moldova
-
 Mongolia
-
 Montenegro
-
 Morocco
-
 Mozambique
-
 Myanmar
-
 Namibia
-
 Nepal
-
 Netherlands
-
 New Zealand
-
 Nigeria
-
 North Macedonia
-
 Norway
-
 Oman
-
 Pakistan
-
 Palestine
-
 Panama
-
 Papua New Guinea
-
 Paraguay
-
 Peru
-
 Philippines
-
 Poland
-
 Portugal
-
 Puerto Rico
-
 Qatar
-
 Reunion
-
 Romania
-
 Rwanda
-
 Saudi Arabia
-
 Serbia
-
 Singapore
-
 Slovakia
-
 Slovenia
-
 Somalia
-
 South Africa
-
 Spain
-
 Sri Lanka
-
 Sweden
-
 Switzerland
-
 Syria
-
 Taiwan
-
 Tajikistan
-
 Tanzania
-
 Thailand
-
 Trinidad and Tobago
-
 Tunisia
-
 Turkey
-
 UAE
-
 Uganda
-
 Ukraine
-
 United Kingdom
-
United States
-
 Uruguay
-
 Uzbekistan
-
 Venezuela
-
 Vietnam
-
 Yemen
-
 Zambia
-
 Zimbabwe
- Forex
- Crypto












