


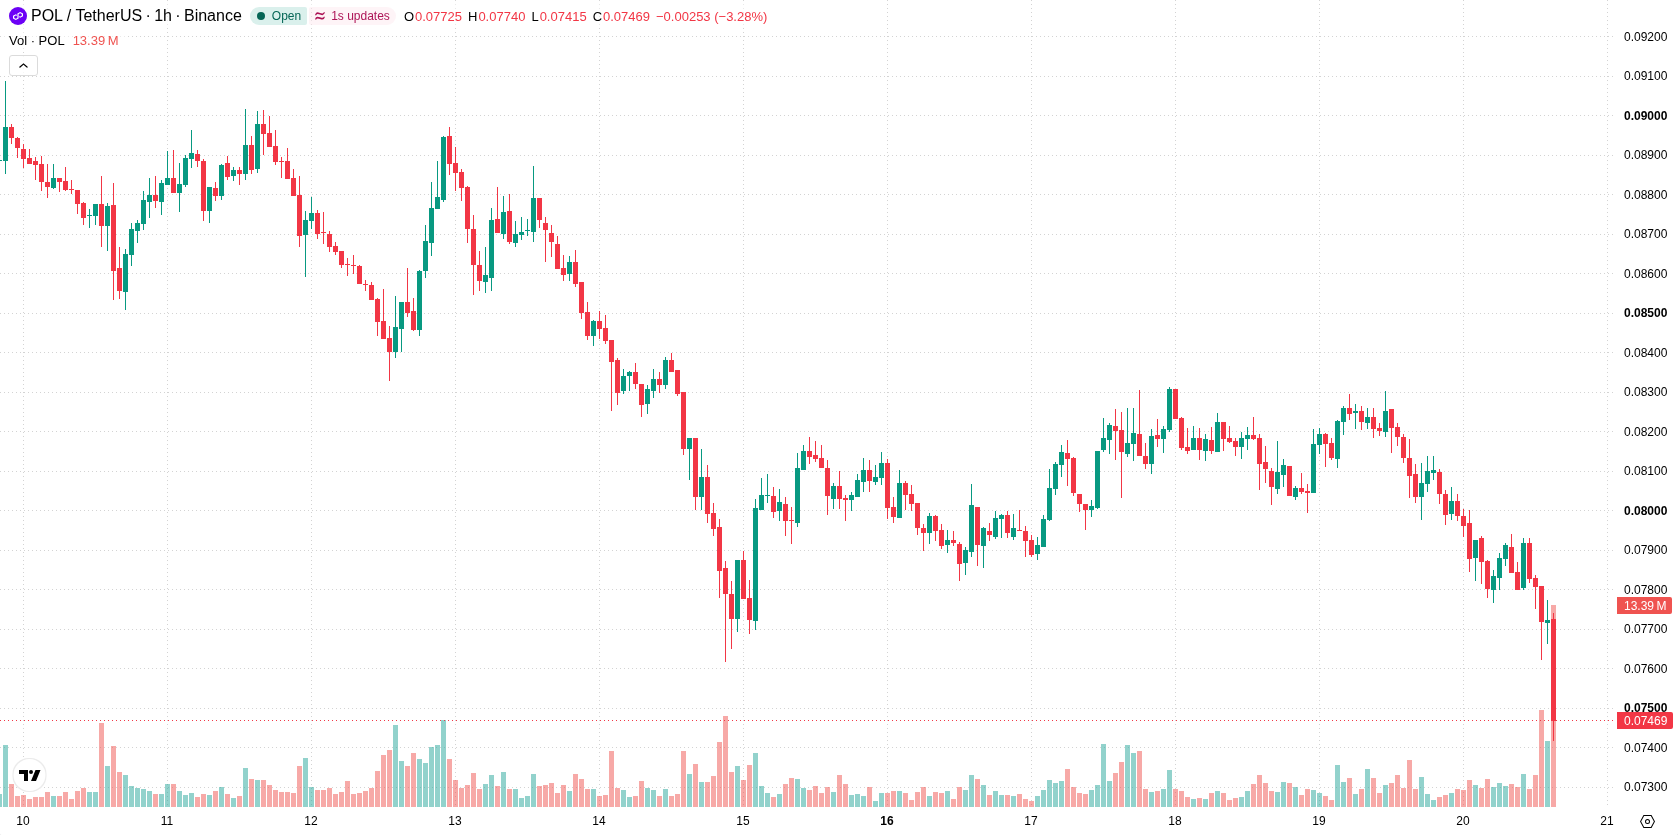
Polygon (POL) is trading at $0.0747 after a 7.77% drop over the last session. The asset sits below its key short- and medium-term moving averages, reflecting ongoing bearish momentum.
 0.08
0.0850
Highlights
- Bybit will temporarily suspend Polygon chain deposits and withdrawals on November 20, 2026 due to the scheduled network upgrade.
- Polygon deployed Heimdall v0.14.0 for mainnet and testnet, updating validator, bridge, and staking protocols on November 20, 2026.
- POL/USD remains under persistent selling pressure with bearish momentum and is expected to fluctuate between $0.0694 and $0.0767 over the next two to three days.
Network upgrade and protocol changes fuel short-term caution
Bybit will support the scheduled network upgrade for Polygon (POL) on November 20, 2026, with deposits and withdrawals via the Polygon chain paused temporarily starting just before the upgrade, according to Announcements Bybit. This short-term suspension may disrupt trading flows and lead users to reposition or avoid exposure in advance of the event window. Separately, Polygon released Heimdall v0.14.0 for its mainnet and testnet on November 20, 2026, introducing protocol updates for validator voting, bridge confirmations, and staking, according to Tokenpost, which may contribute to elevated caution as participants await operational stability after the upgrade.
Seller dominance confirmed as bearish signals limit rebound scope
From a technical standpoint, POL/USD trades below H1 SMA-20 at $0.0789 and H1 SMA-50 at $0.0805, while remaining well below the D1 SMA-200 at $0.0891. The Ichimoku Kijun on the H1 chart now acts as immediate resistance at $0.0792. Among momentum indicators, both MACD and ADX signal a sell bias, and Bull/Bear Power is negative at -0.0011, confirming seller dominance intraday. CCI is currently oversold, whereas RSI and Stoch RSI are neutral, resulting in mixed signals outside of the prevailing bearish momentum.
Downside risk prevails as upside breakout faces resistance
Over the next two to three trading days, POL/USD is expected to remain volatile and fluctuate within the $0.0694 to $0.0767 band, with the probability of an upside move currently described as very low. A bullish scenario would require price to reclaim and sustain levels above immediate resistance; otherwise, further downside below support could reinforce the prevailing downtrend. Any sustained rebound remains unlikely in the near term, and continued consolidation would likely produce a range-bound outcome.
Earlier, analysts noted that Polygon was under sustained technical weakness and defined by a prevailing bearish trend despite ongoing ecosystem developments. The current analysis reinforces this outlook, with new lows, persistent downside signals from momentum indicators, and upcoming network upgrade-related disruptions highlighting the risk of continued volatility and further declines below support as a key scenario to monitor.











-
 Afghanistan
-
 Albania
-
 Algeria
-
 Angola
-
 Argentina
-
 Armenia
-
 Australia
-
 Austria
-
 Azerbaijan
-
 Bahamas
-
 Bahrain
-
 Bangladesh
-
 Belarus
-
 Belgium
-
 Bolivia
-
 Botswana
-
 Brazil
-
 Brunei
-
 Bulgaria
-
 Cambodia
-
 Cameroon
-
 Canada
-
 Chile
-
 China
-
 Colombia
-
 Congo
-
 Costa Rica
-
 Cote d'Ivoire
-
 Croatia
-
 Cuba
-
 Cyprus
-
 Czechia
-
 DR Congo
-
 Denmark
-
 Dominican Republic
-
 Ecuador
-
 Egypt
-
 El Salvador
-
 Estonia
-
 Eswatini
-
 Ethiopia
-
 Finland
-
 France
-
 Georgia
-
 Germany
-
 Ghana
-
 Greece
-
 Haiti
-
 Hong Kong
-
 Hungary
-
 India
-
 Indonesia
-
 Iran, Islamic republic
-
 Iraq
-
 Ireland
-
 Israel
-
 Italy
-
 Jamaica
-
 Japan
-
 Jordan
-
 Kazakhstan
-
 Kenya
-
 Korea
-
 Kuwait
-
 Kyrgyzstan
-
 Laos
-
 Latvia
-
 Lebanon
-
 Lesotho
-
 Libya
-
 Lithuania
-
 Luxembourg
-
 Madagascar
-
 Malaysia
-
 Malta
-
 Mauritius
-
 Mexico
-
 Moldova
-
 Mongolia
-
 Montenegro
-
 Morocco
-
 Mozambique
-
 Myanmar
-
 Namibia
-
 Nepal
-
 Netherlands
-
 New Zealand
-
 Nigeria
-
 North Macedonia
-
 Norway
-
 Oman
-
 Pakistan
-
 Palestine
-
 Panama
-
 Papua New Guinea
-
 Paraguay
-
 Peru
-
 Philippines
-
 Poland
-
 Portugal
-
 Puerto Rico
-
 Qatar
-
 Reunion
-
 Romania
-
 Rwanda
-
 Saudi Arabia
-
 Serbia
-
 Singapore
-
 Slovakia
-
 Slovenia
-
 Somalia
-
 South Africa
-
 Spain
-
 Sri Lanka
-
 Sweden
-
 Switzerland
-
 Syria
-
 Taiwan
-
 Tajikistan
-
 Tanzania
-
 Thailand
-
 Trinidad and Tobago
-
 Tunisia
-
 Turkey
-
 UAE
-
 Uganda
-
 Ukraine
-
 United Kingdom
-
United States
-
 Uruguay
-
 Uzbekistan
-
 Venezuela
-
 Vietnam
-
 Yemen
-
 Zambia
-
 Zimbabwe
- Forex
- Crypto












