

Why is Raydium down today? Seller pressure and technical outlook

Raydium (RAY) is trading at $1.2979, marking a daily decline of 7.61%. The asset currently sits below its short-term moving average while maintaining a position above its medium- and long-term averages.
 2.1904
2.5729
2.1904
2.5729
Highlights
- Raydium completed a $640,000 token buyback, its largest since February 2025, reducing circulating supply and available float.
- Trading volume on September 9, 2026 jumped to over five times the monthly average amid increased activity on LaunchLab and tokenized asset launches.
- RAY/USD trades below its short-term average with price at $1.2979, forecast to consolidate between $1.1474 and $1.4484, with technical signals skewed toward an upward move.
Token buyback and trading surge drive tightening float amid selling
Raydium executed a $640,000 token buyback, its largest since February 2025, which directly reduced the circulating supply and tightened the available float, according to Fxstreet and Coinfomania. On September 9, 2026, the platform’s trading volume surged to more than five times its monthly average amid intensified activity around LaunchLab and tokenized asset launches, highlighting increased user participation as reported by Diariobitcoin. These events suggest an improving fundamental backdrop, though price action has remained under broader selling pressure.
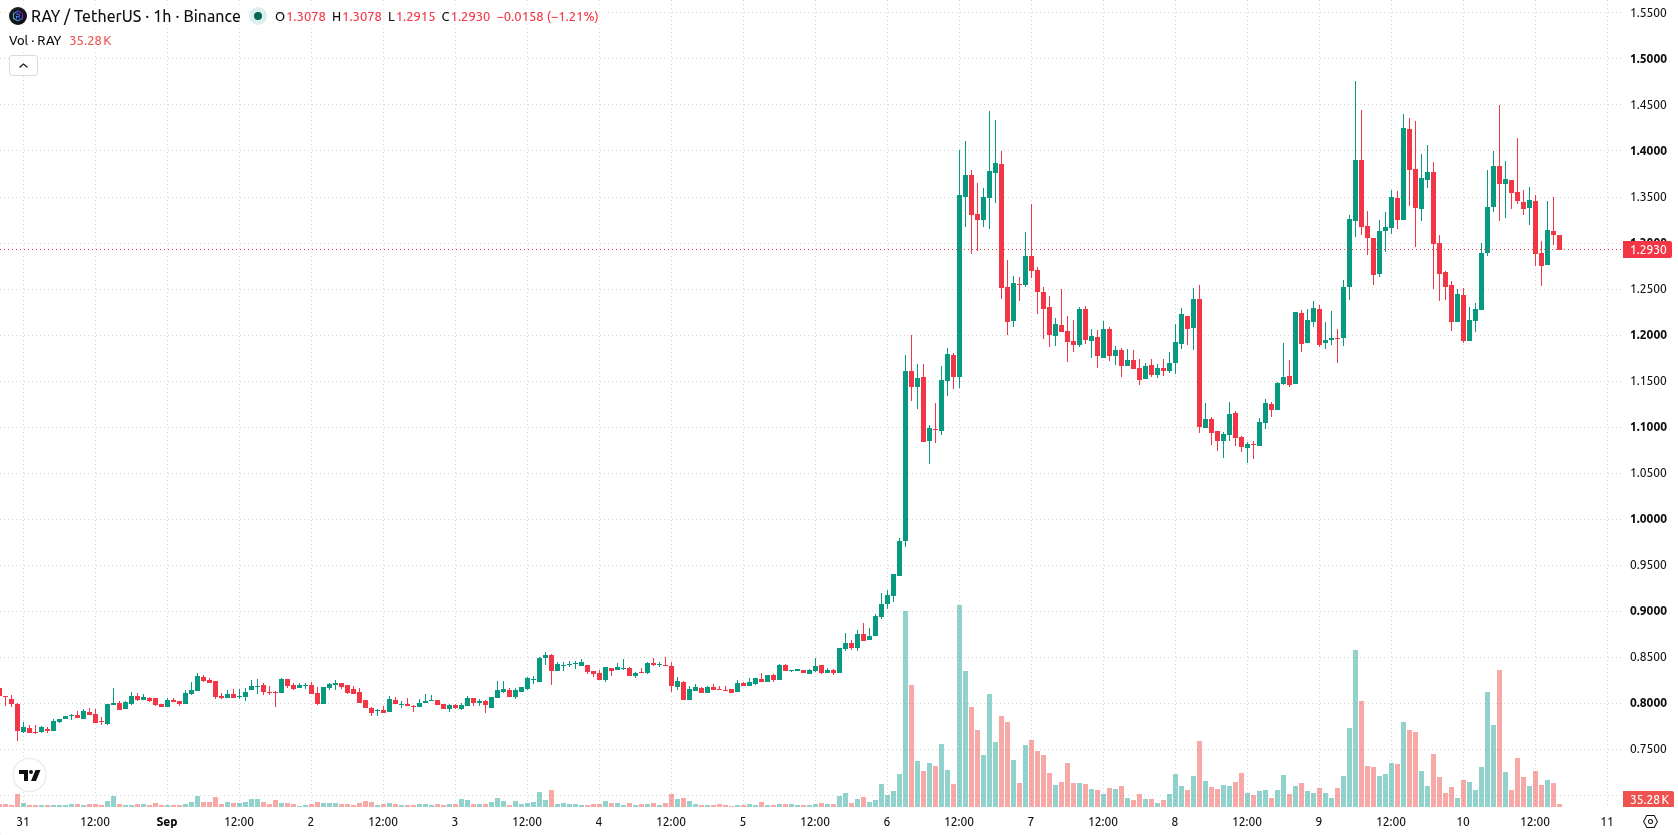
Strong bullish signals clash with oscillator as resistance holds
RAY/USD is positioned below its MA-20 level while remaining above both MA-50 and MA-200, indicating $1.3198 as immediate resistance set by the Ichimoku Kijun. Key indicator readings show MACD giving a Strong Buy signal and ADX indicating Buy, suggesting underlying positive momentum. RSI also suggests Buy, with Stochastic RSI and CCI both neutral, and Bull/Bear Power pointing to strong intraday buyer dominance. However, the Awesome Oscillator issues a Strong Sell, highlighting a divergence from other momentum signals.
Consolidation likely as breakout direction sets risk
Over the next two to three trading days, RAY/USD is expected to trade within a volatility band of $1.1474 to $1.4484. The baseline scenario anticipates consolidation inside this corridor. There is a 71% probability of an upward move, with further gains reliant on a breakout above the Kijun resistance, while a fall below support would raise near-term downside risk.
Earlier, analysts noted that Raydium was demonstrating broad technical strength but warned that overbought conditions could lead to a short-term pullback. The latest developments, including increased fundamental activity and tightened supply, suggest a more complex outlook, making the $1.3198 resistance and the $1.1474–$1.4484 trading corridor critical levels to monitor for potential breakout or reversal scenarios.










-
 Afghanistan
-
 Albania
-
 Algeria
-
 Angola
-
 Argentina
-
 Armenia
-
 Australia
-
 Austria
-
 Azerbaijan
-
 Bahamas
-
 Bahrain
-
 Bangladesh
-
 Belarus
-
 Belgium
-
 Bolivia
-
 Botswana
-
 Brazil
-
 Brunei
-
 Bulgaria
-
 Cambodia
-
 Cameroon
-
 Canada
-
 Chile
Chile
-
 China
China
-
 Colombia
-
 Congo
Congo
-
 Costa Rica
-
 Cote d'Ivoire
-
 Croatia
-
 Cuba
Cuba
-
 Cyprus
-
 Czechia
-
 DR Congo
-
 Denmark
-
 Dominican Republic
-
 Ecuador
-
 Egypt
Egypt
-
 El Salvador
-
 Estonia
-
 Eswatini
-
 Ethiopia
-
 Finland
-
 France
-
 Georgia
-
 Germany
-
 Ghana
Ghana
-
 Greece
-
 Haiti
Haiti
-
 Hong Kong
-
 Hungary
-
 India
India
-
 Indonesia
-
 Iran, Islamic republic
-
 Iraq
Iraq
-
 Ireland
-
 Israel
-
 Italy
Italy
-
 Jamaica
-
 Japan
Japan
-
 Jordan
-
 Kazakhstan
-
 Kenya
Kenya
-
 Korea
Korea
-
 Kuwait
-
 Kyrgyzstan
-
 Laos
Laos
-
 Latvia
-
 Lebanon
-
 Lesotho
-
 Libya
Libya
-
 Lithuania
-
 Luxembourg
-
 Madagascar
-
 Malaysia
-
 Malta
Malta
-
 Mauritius
-
 Mexico
-
 Moldova
-
 Mongolia
-
 Montenegro
-
 Morocco
-
 Mozambique
-
 Myanmar
-
 Namibia
-
 Nepal
Nepal
-
 Netherlands
-
 New Zealand
-
 Nigeria
-
 North Macedonia
-
 Norway
-
 Oman
Oman
-
 Pakistan
-
 Palestine
-
 Panama
-
 Papua New Guinea
-
 Paraguay
-
 Peru
Peru
-
 Philippines
-
 Poland
-
 Portugal
-
 Puerto Rico
-
 Qatar
Qatar
-
 Reunion
-
 Romania
-
 Rwanda
-
 Saudi Arabia
-
 Serbia
-
 Singapore
-
 Slovakia
-
 Slovenia
-
 Somalia
-
 South Africa
-
 Spain
Spain
-
 Sri Lanka
-
 Sweden
-
 Switzerland
-
 Syria
Syria
-
 Taiwan
-
 Tajikistan
-
 Tanzania
-
 Thailand
-
 Trinidad and Tobago
-
 Tunisia
-
 Turkey
-
 UAE
UAE
-
 Uganda
-
 Ukraine
-
 United Kingdom
-
United States
-
 Uruguay
-
 Uzbekistan
-
 Venezuela
-
 Vietnam
-
 Yemen
Yemen
-
 Zambia
-
 Zimbabwe
- Forex
- Crypto












